This tutorial explores how you can translate levels from Rhino to Revit via Excel. While this may be overkill for smaller projects, it may prove to be useful for high-rise towers which were initially conceived within Grasshopper.
Step 1: Generate levels in Grasshopper
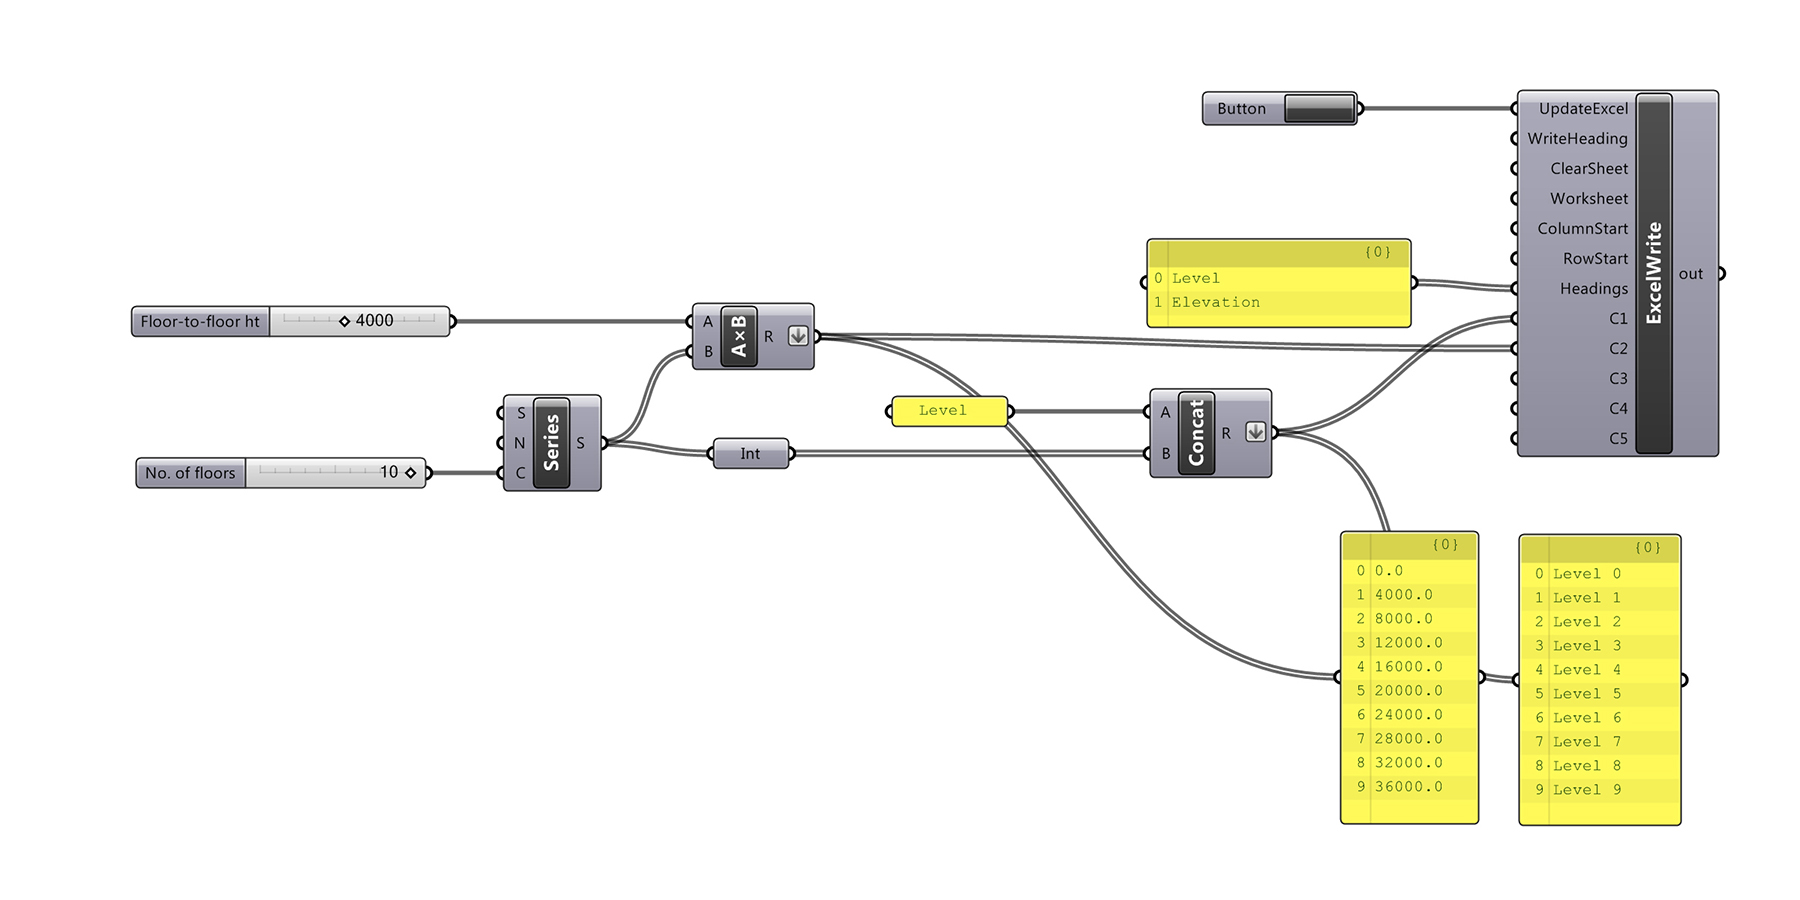
The first step is to generate a series of level names and elevations within Rhino/Grasshopper. The example below uses a series component to create the number of levels in the project. This list is then multiplied by the typical floor-to-floor height to get the elevations. If you’re building has atypical floor-to-floor heights, extract the Z-coordinates of the defining geometry which represents the levels. Next, we’ll use the concatenate component to name the levels. Both the elevations (number) and level names (string) can then be flattened and fed into the Lunchbox ‘ExcelWrite’ component.
Step 2: Export to Excel
Depending on which ExcelWrite Component you use, you will need to modify the definition. If you use the legacy component, you’ll need to ensure Excel is open first before activating the Boolean button (or toggle). Using this method, you can set the WriteHeading input to ‘False’ and the RowStart to ‘0’.
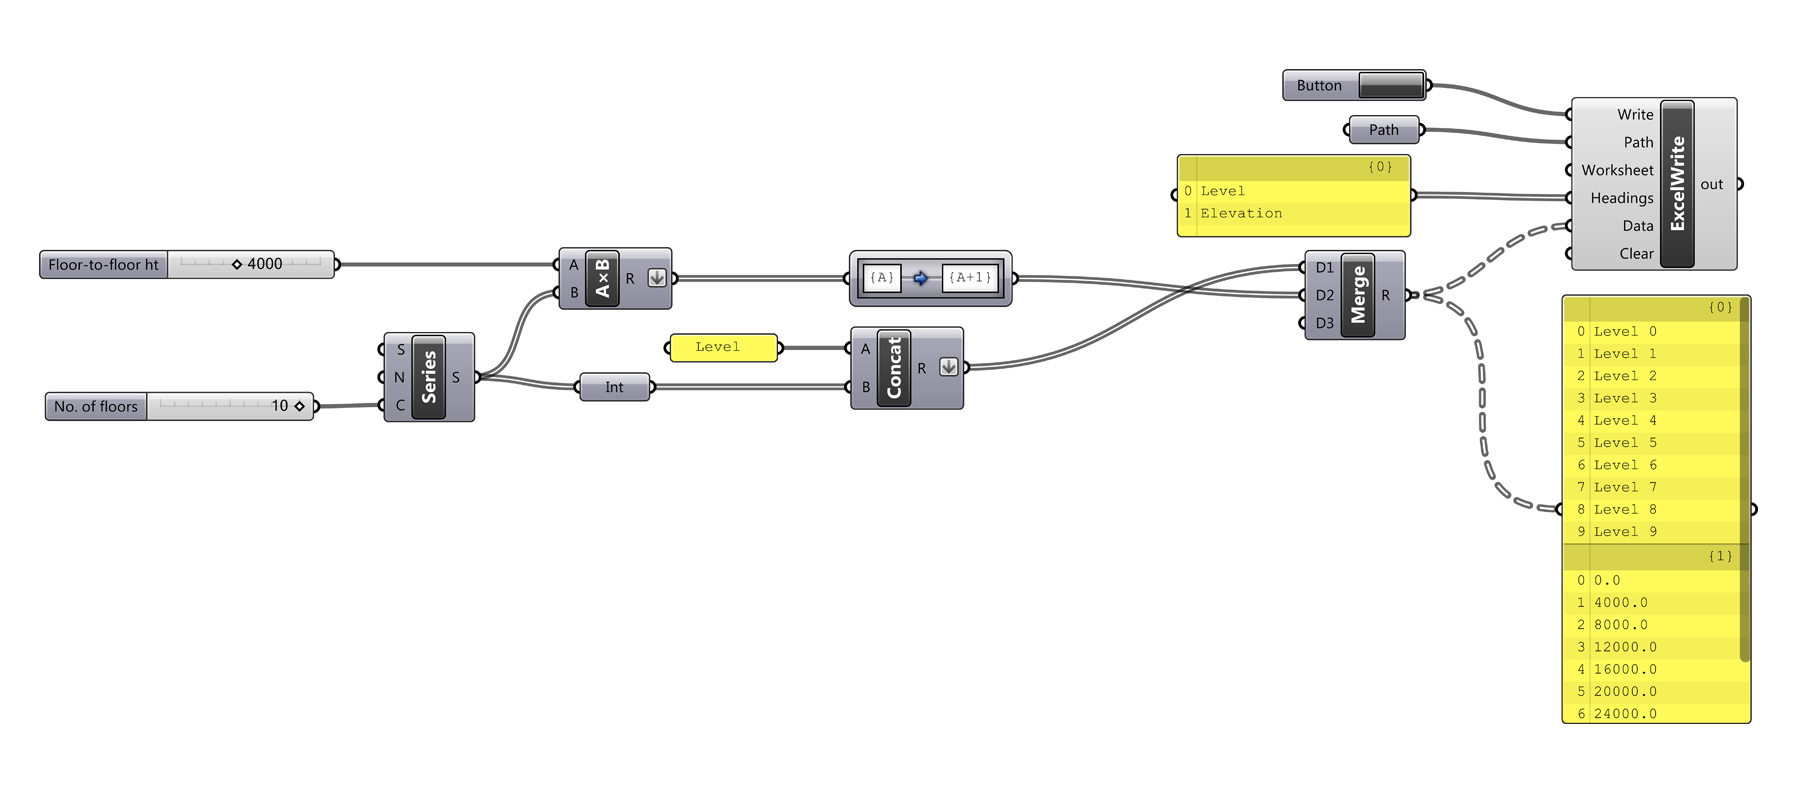
If you use the new ExcelWrite component, you’ll likely need to use the Path Mapper component to change the data structure as shown below. The new component doesn’t require Excel to be open before activating the Boolean button (or toggle), but you will need to define the file path. This component will always export headings.
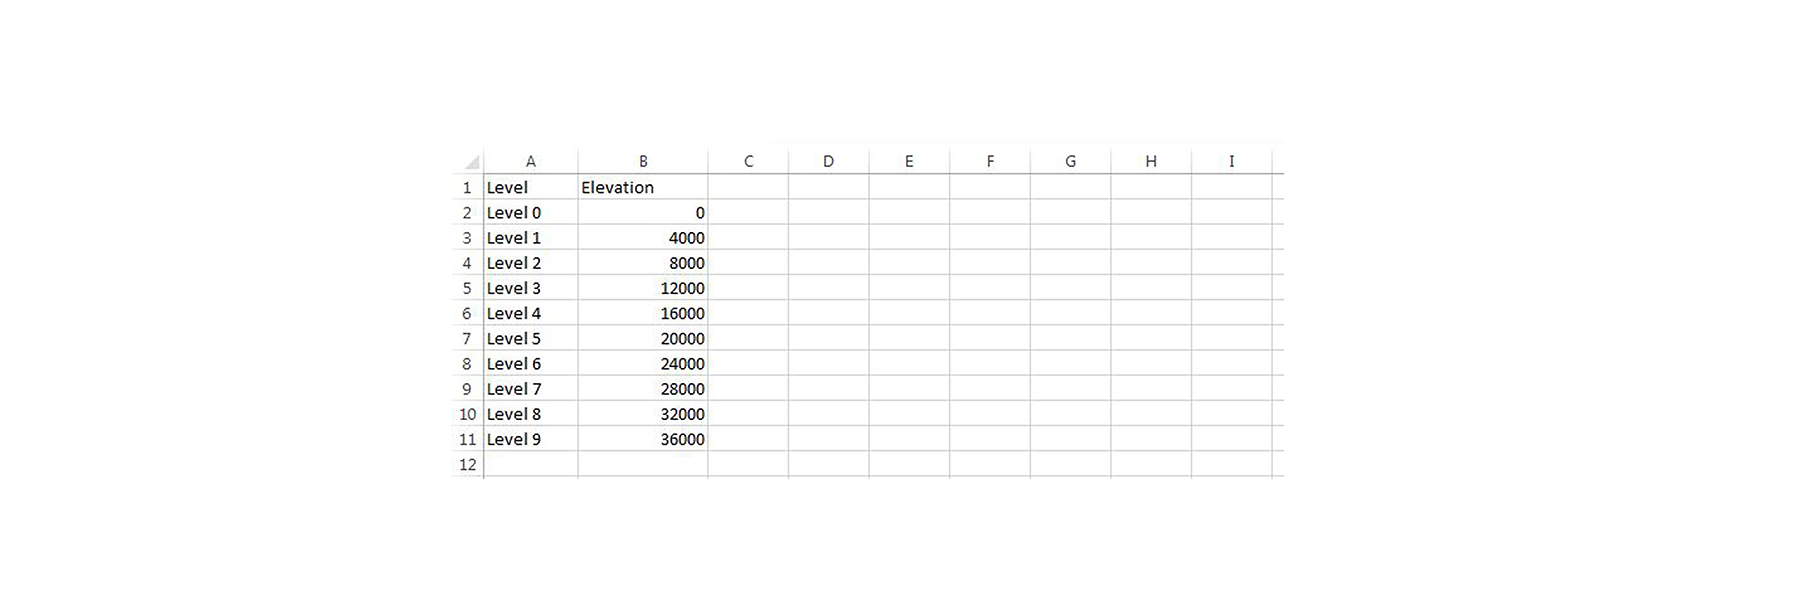
Both options should create an Excel file which looks something like this. The only difference will be whether the headings are exported or not.
Step 3: Import using Dynamo
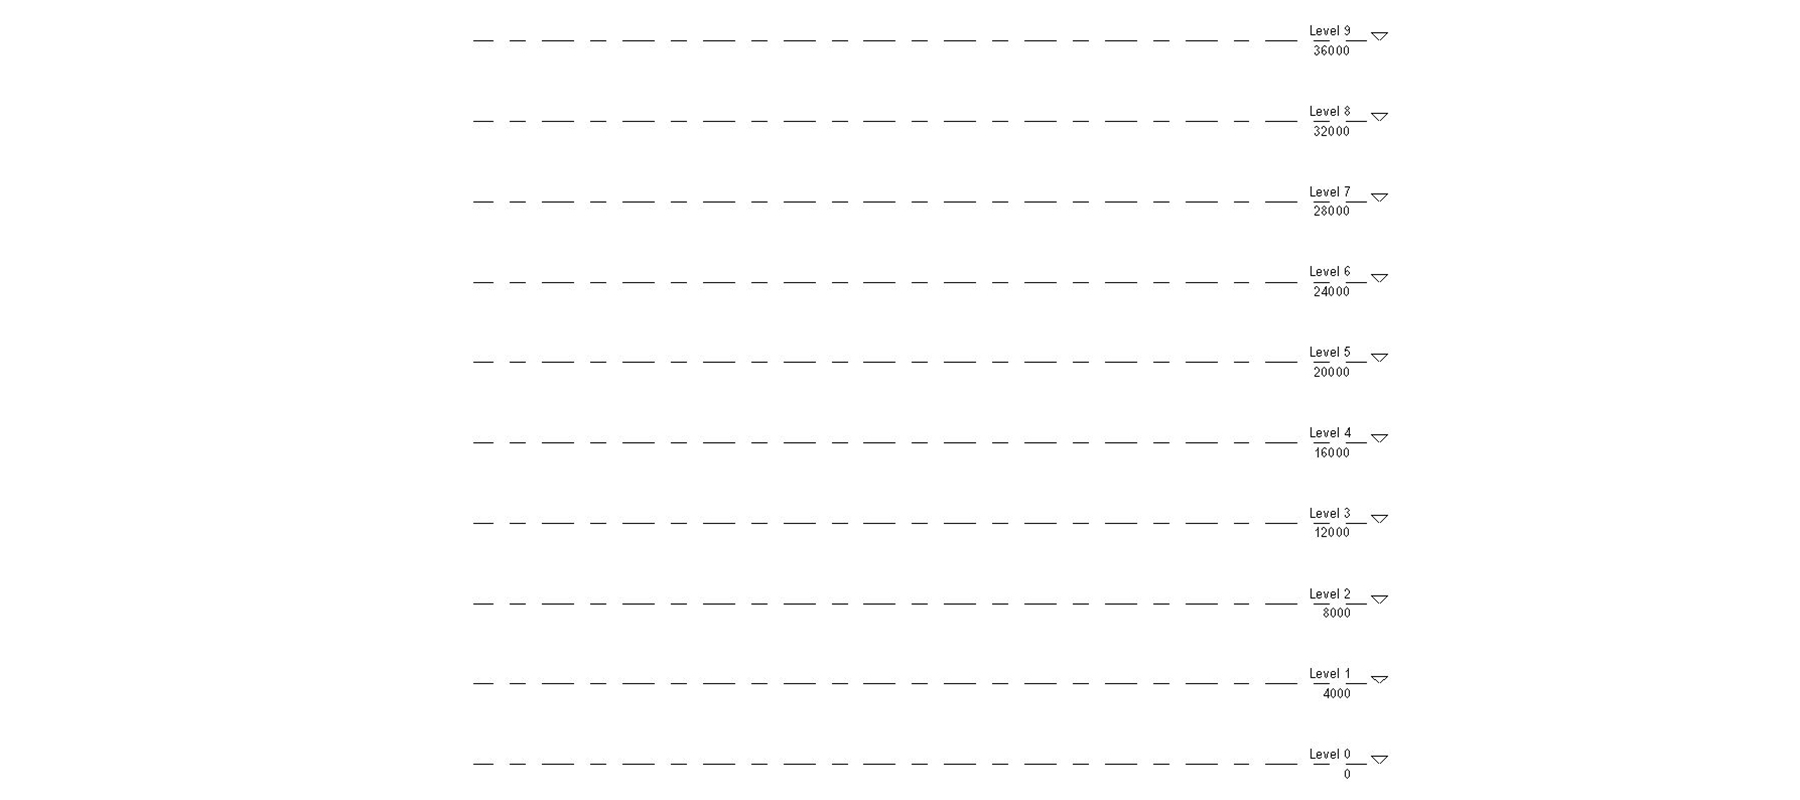
The Dynamo graph imports this data with an option to remove headers. Note that the data is set to not be strings. Remember, like any other programming software, Dynamo starts counting from 0, not 1. So column A (level name) is 0, while column B (elevation) is 1.

Troubleshooting
Ensure you run Dynamo using ‘Manual’ or via Dynamo Player, as rerunning the graph will cause duplicate levels to be created. Another problem that sometimes arises is that the Excel data cannot be imported into Dynamo. This known issue can be resolved by repairing Microsoft Excel in ‘Add or Remove Programs’ within Windows.