
When placing views on sheets, Revit numbers them in the order in which they are placed. If you are not diligent, chances are you’ll need to adjust the viewport’s positions and rename their Detail Number parameter so that they follow a logical sequence, such as left to right and top to bottom. This renaming process can prove problematic as Revit will not allow you to have two viewports with the same Detail Number parameter. If you try, Revit will return an error saying, “Detail Number is already in use. Enter a unique number.” To resolve this, it often requires temporarily renaming the viewports to make the desired values ‘available’ before updating them to their final values—a painful and time-consuming process to perform manually, especially if the viewport’s positions are updated frequently.
Renumbering viewports with Dynamo
To solve this problem, Parametric Monkey has developed a Dynamo graph, which is available as part of our Dynamo Package Development service. The graph takes the selected sheets in the Project Browser, retrieves the viewports on those sheets, and updates their Detail Number parameter according to a specific logic. Before running the graph, select the sheets to be modified in the Project Browser.
To run the graph:
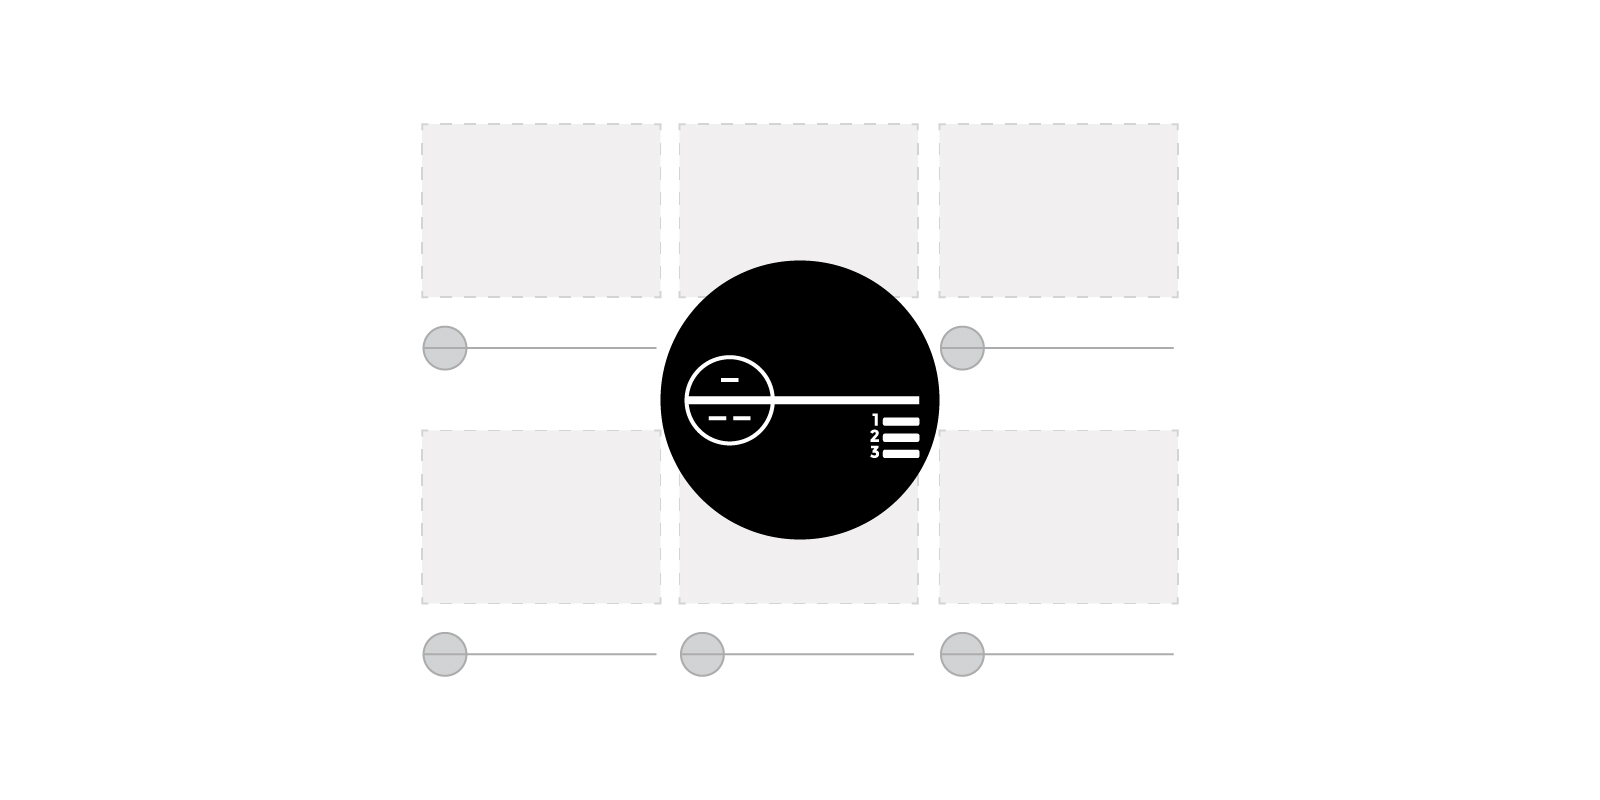
- Define the naming convention for the viewport’s Detail Number (#1). Note that ‘Detail Number’ is misleading, as the parameter is text. The graph, therefore, allows the viewports to be numbered numerically or alphabetically.
- If ‘numeric’ is chosen, specify the start value (#2) as well as the digit padding (#3). For example, a start value of ‘1’ with digit padding of 2 will result in the first value being ’01’.
- If ‘alphanumeric’ is chosen, specify the start value (#4), for example, ‘A’.
- Define how the viewports should be grouped (#5) and the threshold for grouping (#6). Viewports can be grouped in either rows (horizontal) or columns (vertical).
- Specify if the grouping order should be reversed (#7). By default, rows are ordered from top to bottom, and columns are ordered from left to right.
- Specify if the sort order should be reversed (#8). By default, rows are sorted from left to right, and columns are sorted from top to bottom.
- Press Run.
Computational logic
The graph collects all sheets selected in the Project Browser. If no sheets are selected, an error is returned. The viewports on the sheets are then extracted, and their locations are determined.
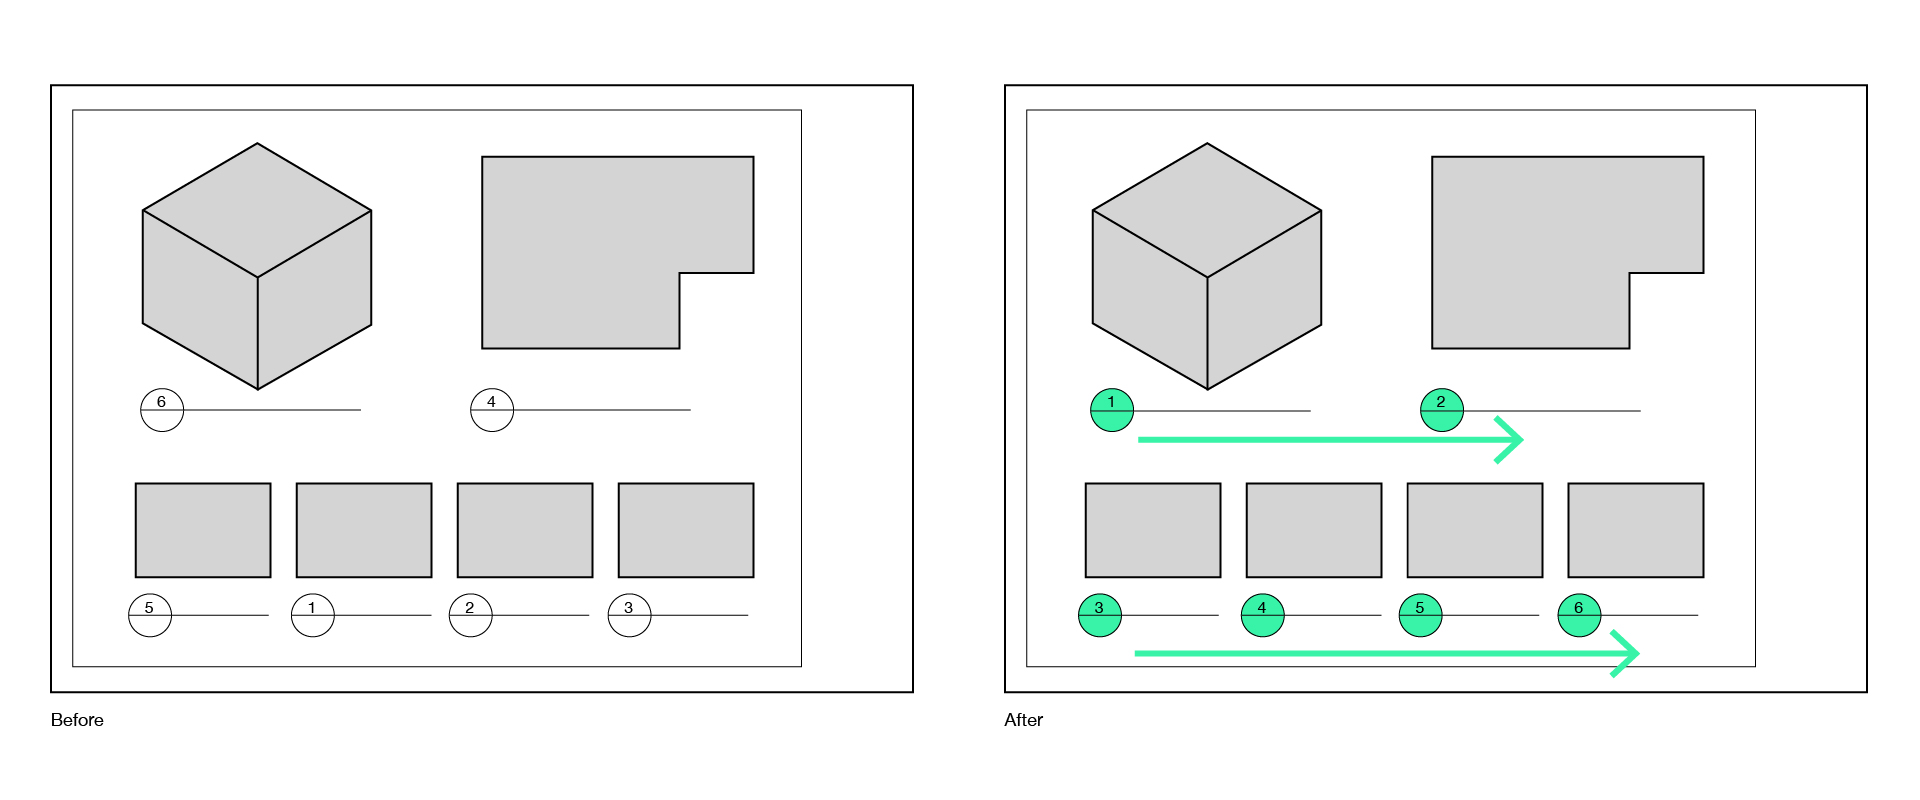
Next, viewports are grouped based on the viewport grouping logic (input #5). If ‘Rows‘ is selected with a grouping threshold of ‘100’, viewports will be grouped into rows based on their centre point’s Y-coordinate, rounded to the nearest 100. The grouping threshold, therefore, enables viewports that are not perfectly aligned to be grouped. By default, rows are ordered top-to-bottom. However, this can be reversed if desired (input #7).
If ‘Columns‘ is selected, viewports will be grouped into columns based on their centre point’s X-coordinate. By default, columns are ordered left-to-right. However, this can be reversed if desired (input #7).
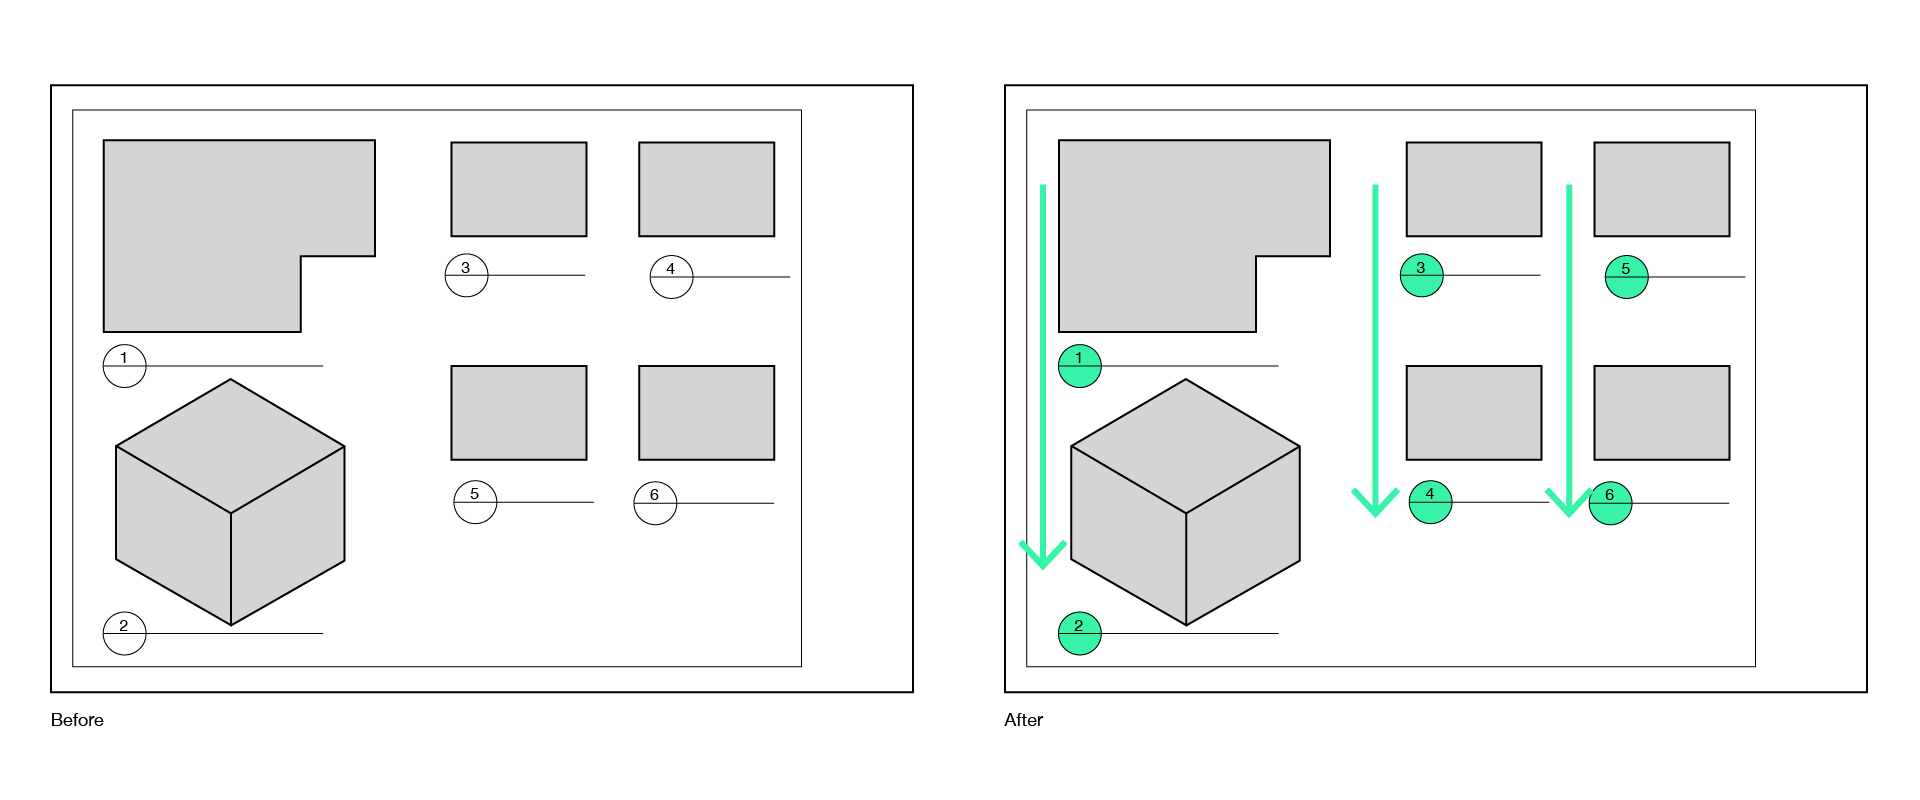
Once grouped, the viewports are sorted. By default, rows are sorted from left to right, and columns are sorted from top to bottom. However, this can be reversed if desired (input #8). Finally, the Detail Number sequence is generated based on the naming convention logic (input #1) and the viewports are updated. The graph can be run multiple times without returning the “Detail Number is already in use” error message, streamlining your documentation and saving you time.
Conclusion
To find out more about our Dynamo Package Development service, drop us a line and discover how we can automate your Revit workflows.