
One of the simplest methodologies for undertaking a view analysis is to use an isovist, which measures the area (2D) or volume (3D) of space visible from a given point in space. This value represents the solution’s fitness; the larger the area, the greater the visibility. An Isovist view analysis is highly beneficial for projects where visibility is essential, such as urban planning, shopfronts in a retail mall, or hospital patient visibility from a nurse station. In this scenario, the aim is to maximise visibility. The same technique can be used to measure the visual impact, say, for an adjacent or heritage-listed building. If you want to perform a view analysis for solar analysis, check out our views from sun tutorial instead.
Creating an isovist with Dynamo
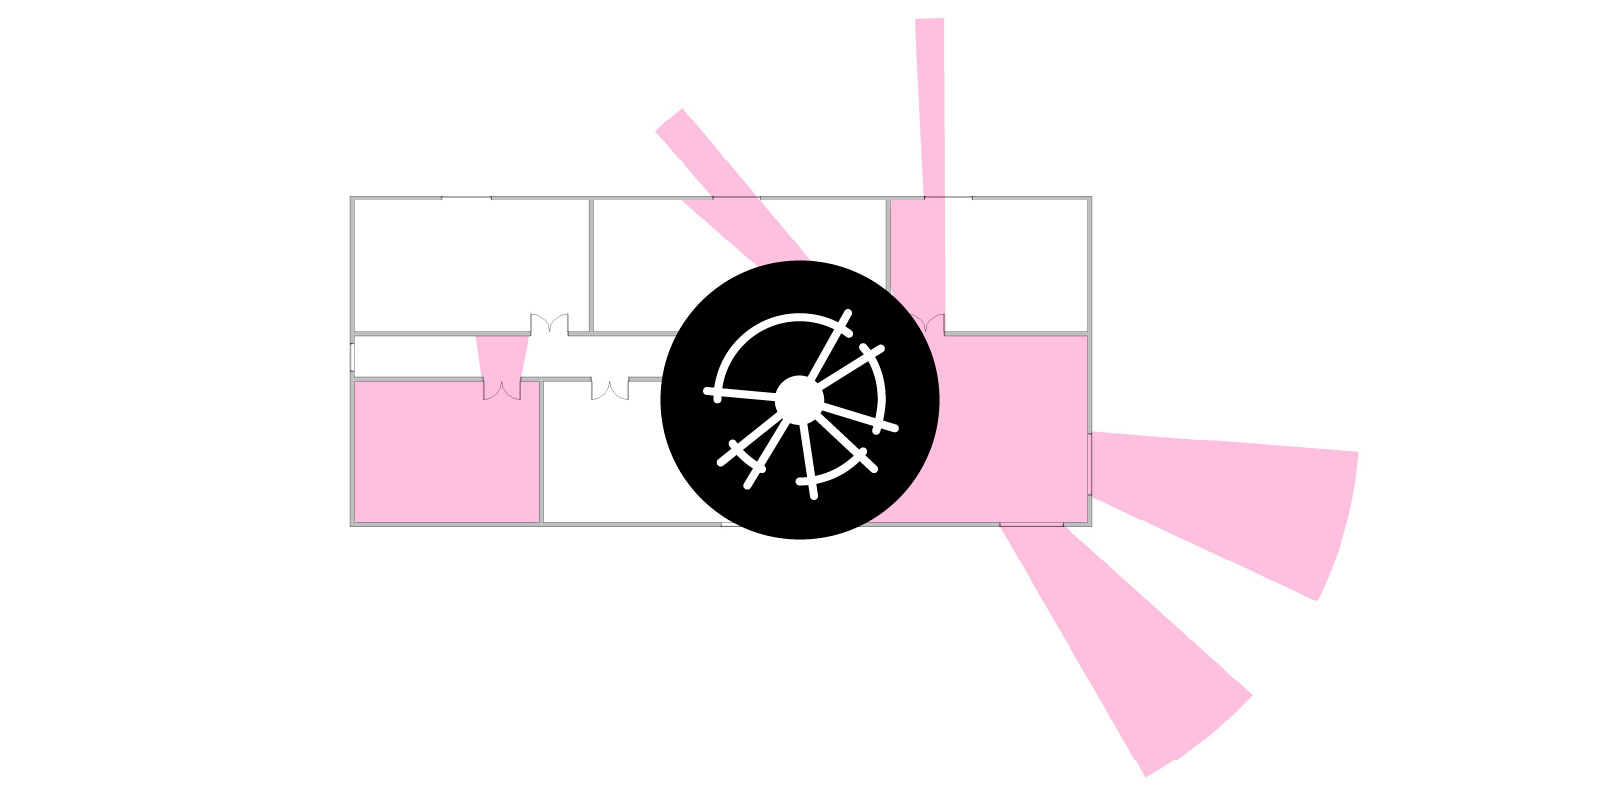
Since Revit has no out-of-the-box functionality to create isovists, it is necessary to use Dynamo. To solve this issue, Parametric Monkey has developed a Dynamo graph, available as part of our Dynamo Package Development service. The graph requires a generic annotation family instance to define the eye location. Once run, a filled region is created, and the fitness value is assigned to the room in which it is located.

Before running the graph, ensure that a project parameter (Manage > Settings > Project Parameters) has been created to capture the view fitness. The parameter should be an ‘Instance’ parameter, and the type should be set to ‘Area’. It also needs to be assigned to the ‘Rooms’ category.

To run the graph:
- Ensure your active view is a floor plan.
- Select the generic annotation family instance that defines the eye position (#1).
- Define the height of the eye (#2). This is generally 1,500mm.
- Select the model elements to act as obstacles (#3). If only walls are selected, the isovist will pass through any openings. If this is not desired, doors and windows should also be selected.
- Define the isovist radius (#4).
- Define the ray count (#5). The lower this value, the lower the accuracy of the isovist.
- Specify the filled region type to be applied (#6).
- Define if an <Invisible lines> graphic style should be applied to the filled region boundary (#7).
- If input #7 is False, define the line style to be applied to the filled region boundary (#8).
- Define an optional parameter name to store the fitness value (#9).
- Define the area units of the fitness parameter (#10). For example, if the model length unit is millimetres but the fitness should be returned in meters, set the value to ‘Square meters’.
- Press Run.
Computational logic
The location of the generic annotation family instance is calculated and adjusted to the correct eye position. A 2D isovist is then generated, which conforms with the obstruction geometry. The resulting polycurve is then simplified to remove unnecessary line segments for downstream editing. A filled region is then created in the active view, and its boundary curves updated.
Finally, the associated room is returned, and the area of the isovist is pushed to the room’s parameter. Note that if the generic annotation family instance is located within multiple rooms, for example, an overlapping room from the level below, only the first room found will be updated.
Conclusion
Undertaking a view analysis can be a powerful design tool. Whether the intention is to maximise the view or minimise the visual impact, with automated routines such as this one, this process can be performed quickly and accurately.
To learn more about our Dynamo Package Development service, drop us a line and discover how we can automate your Revit workflows.


3 Comments
Jason
Hi! Thank you for your script! This is really helpful
I’d like to know why there is no ‘isovist’ in the my ‘select filled region type’ node
Hope to hear from you soon!
Paul Wintour
Hi Jason. The select filled region type node reads what ever is in your Revit project. I just happened to create a filled region type called ‘isovist’ but you can use whatever filled region type you like.
Jason
Thank you Paul!! It is working perfectly now!