

The provision of adequate viewing standards in a stadium is a crucial factor in ensuring that seated accommodation is both safe and serves its intended purpose. Referencing the ‘Green Guide‘, which was produced by the Department for Culture, Media and Sport in the UK, this tutorial will explain how to use Dynamo to automate the seating bowl for a stadium.
Step 1: Pitch
The first step is to draw your playing field. Depending on the type of Stadium you are designing, this might be purpose-built, e.g. football only, or multi-purpose. I would recommend using a generic model family with model lines so that it will be visible in 3D. There is no need to parameterise the family as the pitch is unlikely to need to flex. The exception to this would be if the pitch were to be multi-purpose, in which case it is best to create separate generic model families for each type, and the nest these into a parent family and use the visibility parameter for graphic control.

Step 2: Point of focus
The next step is to define the point of focus. The term ‘focal point’ is a bit of a misnomer as it is not a point, but rather an imaginary line delineating the extent of the sightline. The location of the point of focus will vary depending on the sport. Football, for example, might be aligned with the nearest touchline but have filleted corners. Rugby, on the other hand, may allow the point of focus to be within the try zone. Obviously, the more of the pitch you can see, the better.
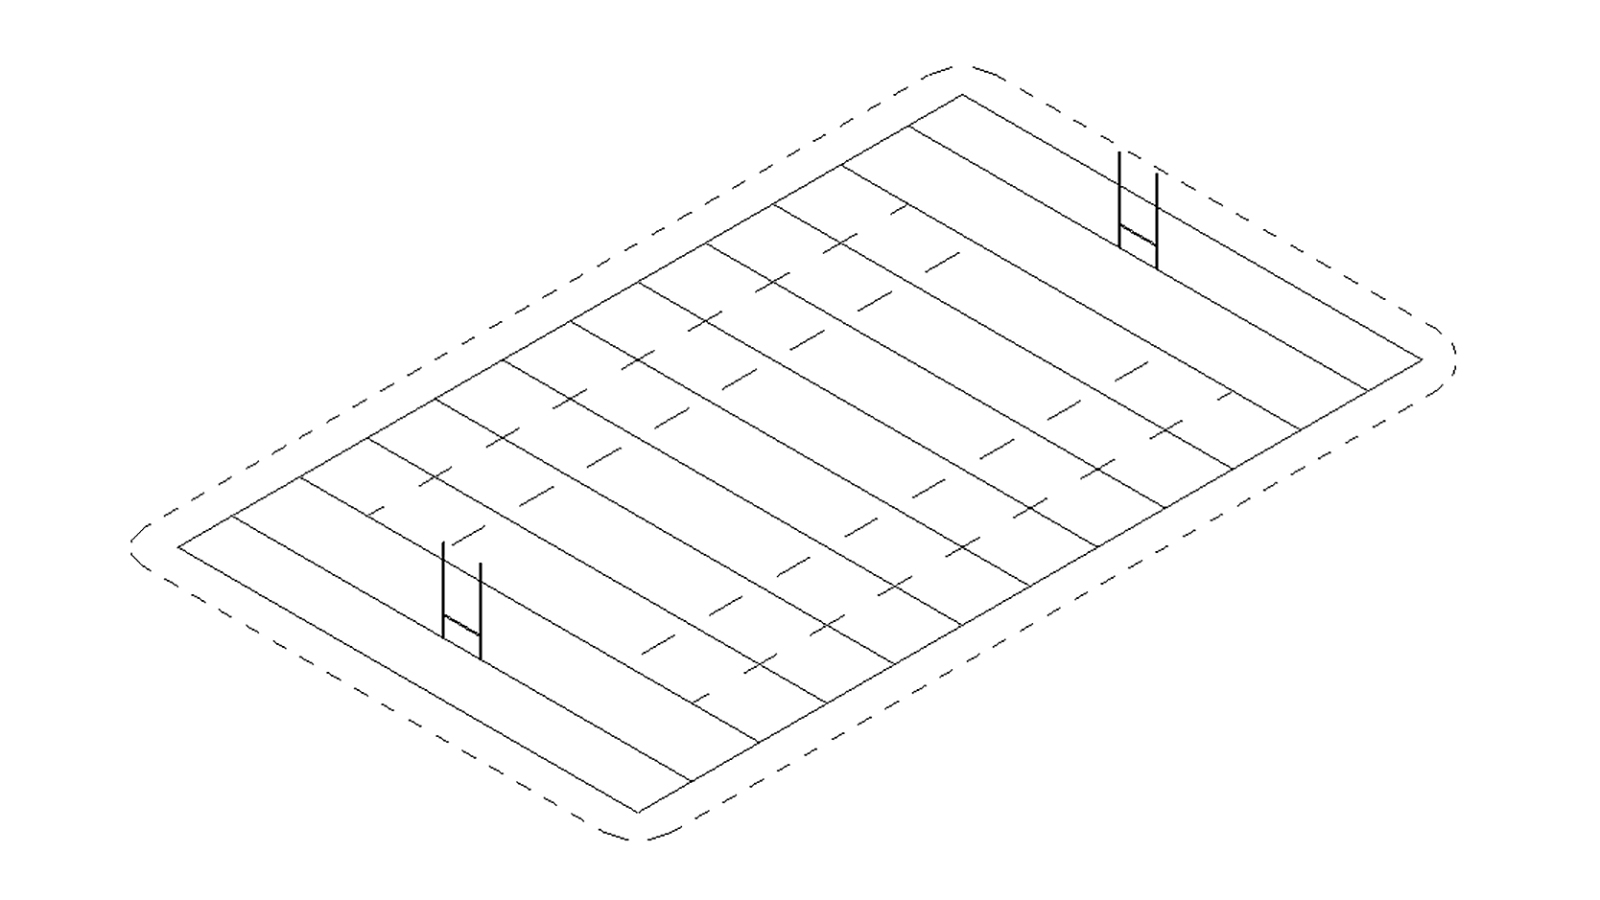
For illustrating the point of focus, we simply need to use mode lines (shown dashed above). It is important to remember that lines have a direction which will impact how they are offset. Best practice is to ensure the lines are drawn in a clockwise direction, although the Dynamo nodes shown later will ensure all curves are in the same direction.
Step 3: Sightlines
The term sightline refers to the ability of a spectator to see a predetermined focal point over the top of the heads of the spectators immediately in front. The better the quality of the sightline, the more likely it is that spectators will remain seated during the event. Ensuring adequate sightlines is, therefore, an important part of providing safe seated accommodation. The quality of a sightline is often expressed as a ‘C-Value’. The recommended C-Value for spectators varies according to the sport. The C-Values can be described as shown on the table below:
| C-Value (mm) | Description |
|---|---|
| 60 | Need to look between heads in front |
| 90 | Can see well with head tilted backwards |
| 120 | Optimal viewing standard |
| 150 | Can see well even if over spectators with hats |

C-Value calculation
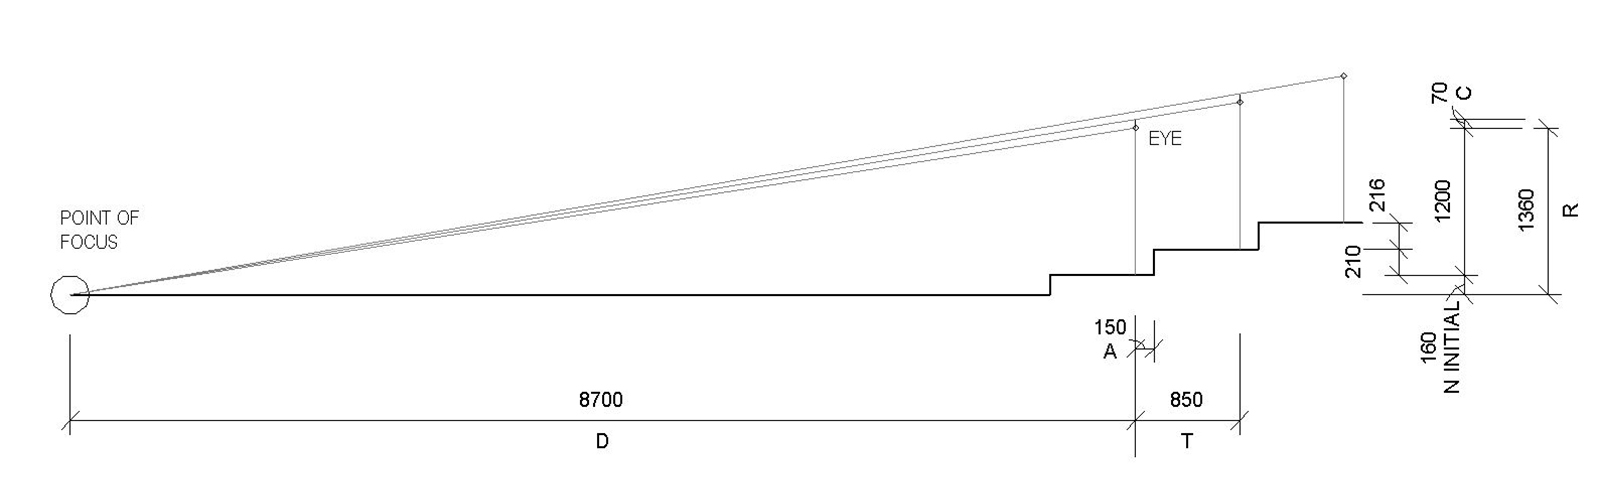
As shown in the diagram above, Section 12.3 (p.109) of the Green Guide demonstrates how the C-Value can be calculated using the formula: C = ((D(N+R))/(D+T)) – R. However, typically we will have a predefined C-Value and will want to calculate the resulting riser heights (N), which will be different from row to row. To get N, we can use algebra:
C = ((D(N+R))/(D+T)) – R
R+C = (D(N+R))/D+T
((R+C)*(D+T))/D = N+R
(((R+C)*(D+T))/D)-R = N
Since we need to know the previous N value to calculate the next N value, we need to use recursion. Recursion is a computational process which requires a series of operations to be continually performed until a stopping condition is met. In Dynamo, this is best achieved using a simple Python script:
#Load required modules
import clr
clr.AddReference('ProtoGeometry')
from Autodesk.DesignScript.Geometry import *

#coverts to integer if text or number
numRisers = int(IN[0])
# Seating step width
T = IN[1]
#Initial N value (starting height)
N = IN[2]
#C value
C = IN[3]
#Point of focus
D = IN[4]
#sets counter to zero
Rprev = 0
#container for output
rList = []

#create list of N distances (riser heights)
for i in range(numRisers):
    Rcur = N + Rprev
    N = (((Rcur+C)*(D+T))/D)-Rcur
    rList.append(Rcur)
    D = D+T
    Rprev = Rcur

#Assign your output to the OUT variable.
OUT = rList
C-value node
To save you the trouble of writing this, you can use the ‘Stadium.Cvalue‘ node from the BVN Dynamo package. The custom node defines the constants including Seating row depth (T); Eye offset from rear of row (A); Focus distance (F); Number or risers; Initial N value, C Value; and, Eye height (E).

The ‘frontDownturn’ input is typically the same as the initial N value (N) unless you are doing multiple tiers (refer Step 5). The Eye offset at rear of row (A) has a default value of 150mm, while Eye height (E) has a default value of 1200mm. Both of these are considered industry standard dimensions. Focal distance (F) was defined in Step 2 and relates to the sport/pitch. As you can see, the vertical height to the point of focus (R) is not explicitly defined. This is because the initial value of R can be calculated as:
R = initial N value (N) + eye height (E)
Similarly, the horizontal distance from the eye to the point of focus (D) is not explicitly defined. This is because the initial value of D can be calculated as:
D = Seating step width (T) – eye offset from rear of row (A) + focus distance (F)
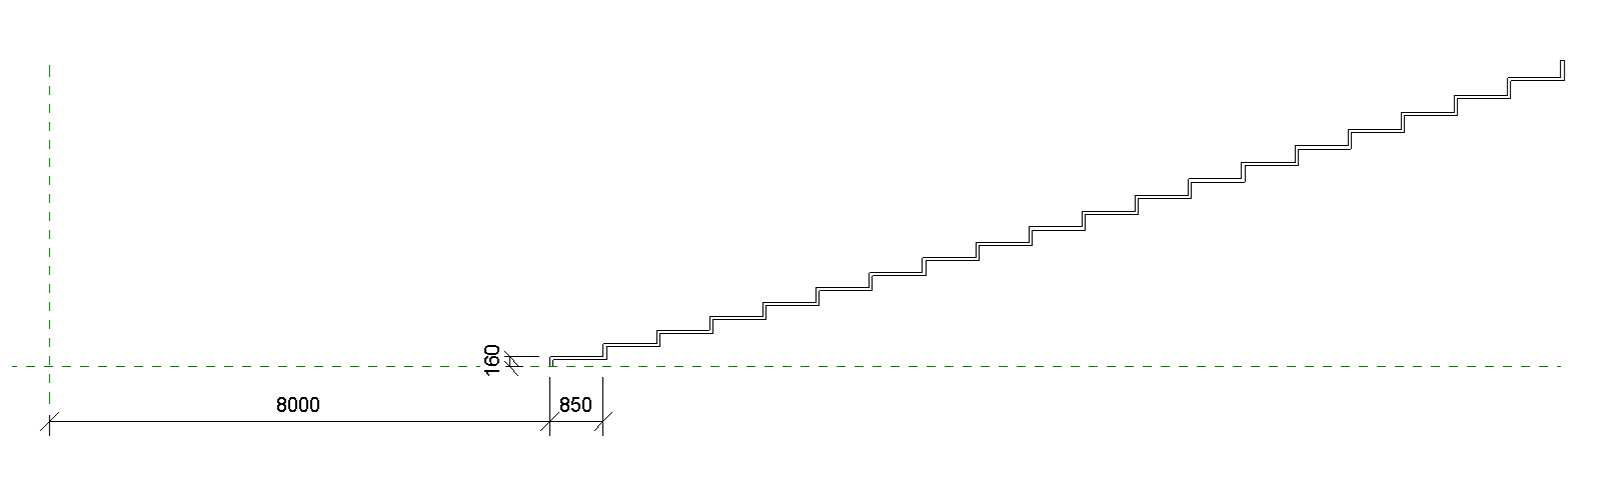
Seating row depth
Seating row depth (T) relates to what the Green Guide terms a ‘clearway’ (refer Section 12.14, p.118). The clearway is the distance between the foremost projection of one seat and the back of the seat in front of it. The size of the clearway determines how safely and freely spectators and other personnel can move along rows of seats. The minimum clearway should be 400mm. It is therefore recommended that the seating row depth (T) should be at least 800mm, although 850mm is more common. (Note the key to the diagram below is different to the C-Value diagram above.)

Outputs
The ‘Stadium.Cvalue’ node will output several values: the Z-coordinates of the top of the riser; the Z-coordinates of the bottom of the riser; the Z-coordinate of the eye (R); riser heights (N); and, row offsets (D). These values can then be used to generate the seating bowl profile in the next step.
Step 4: Seating bowl profile
Generally speaking, a seating bowl can be generated as a sweep using a profile and path. Typically, but not always, the path will be the line of focus to ensure consistent C-Values. The sweep path (line of focus) can be manually drawn, as described in Step 2. The sweep profile, on the other hand, can be automated now that we have the values from Step 3. There are multiple methods we can use to generate the profile curve:
Option 1 – Revit Project Environment
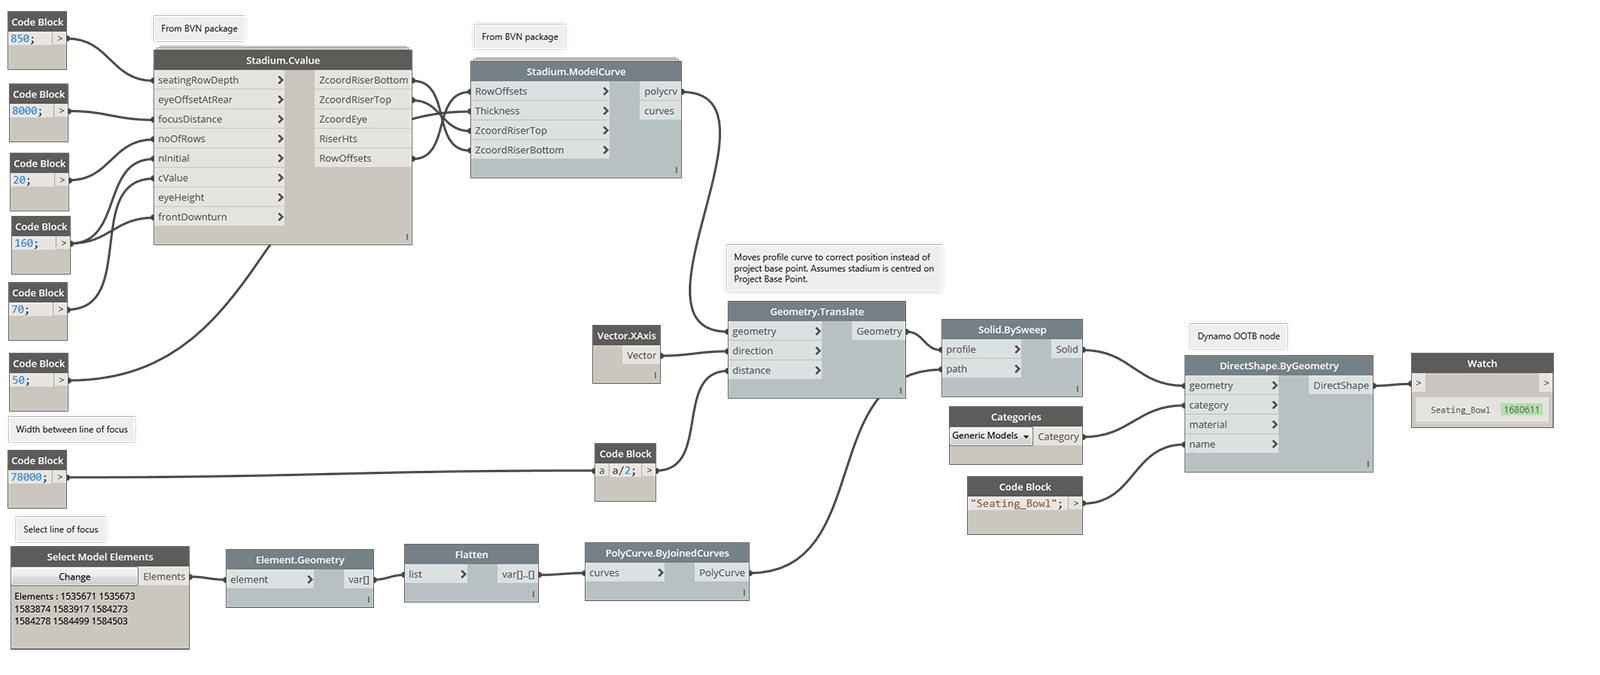
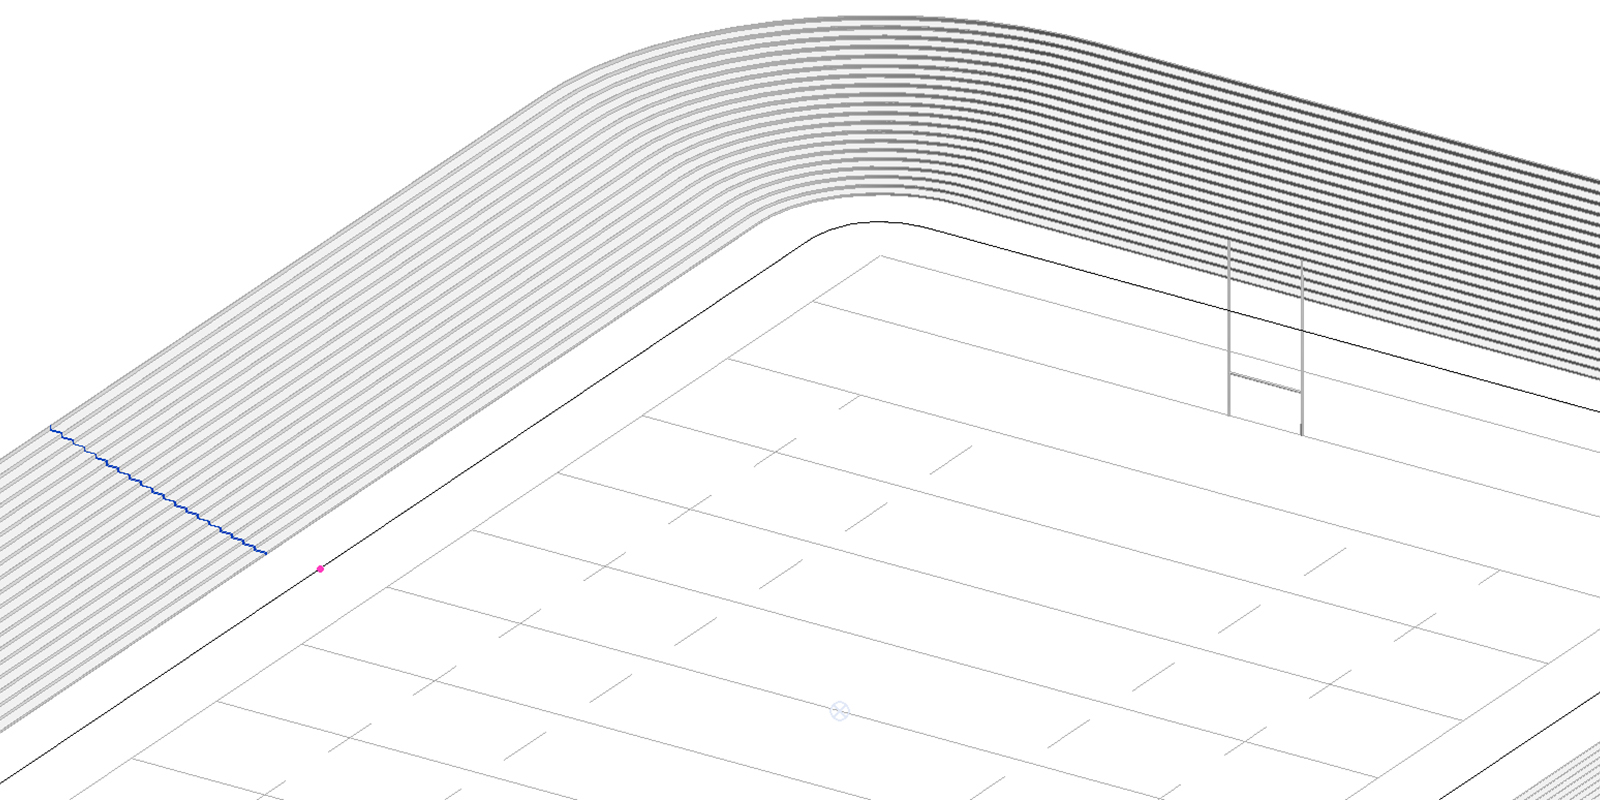
In this scenario, we can use the ‘Stadium.ModelCurve’ node from the BVN package to create the sweep profile directly within the Revit project environment. This method will create a polycurve in the XZ plane which will act as the sweep profile. Note, it is assumed that the Stadium is centred around the Project Base Point. If not, you’ll have to amend the script so that the sweep profile is translated into the correct position. Also, due to how Revit generates sweeps, it is unlikely that the sweep will work on a rectangular path. The path should have fillets or chamfers, which is more realistic, for Revit to generate the sweep. Once the sweep profile is created, we then have two main options for generating the sweep:
Option 1A – Direct shape with Dynamo
Using Dynamo, we can sweep the profile around the line of focus. Using the resultant solid, we can then generate either a direct shape or import instance. However, the baked geometry will have limited capacity to be modified outside of Dynamo. Furthermore, if you use Dynamo’s OOTB ‘DirectShape.ByGeometry’ node, the geometry will be tessellated, which will cause unnecessary visual complexity.

Note that if you didn’t define the materials of the direct shape in Dynamo, you’ll need to modify the ‘Dynamo’ material properties. To do this, go Manage > Settings > Materials.

While this method can be considered the most parametric in terms of pure Dynamo workflow in the sense that the results can be seen immediately within the Revit project, the result is a less user-friendly Revit element. To allow the greatest versatility and flexibility, this method is best avoided.
Option 1B – Manually create an in-place mass
We can use Dynamo to generate model lines for the profile curve and then manually create an in-place mass. To do this, go Architecture > Build > Component > Model In-place, and set family category to ‘Floors’. Then use the ‘pick lines’ command to define the profile. The creation of the in-place mass needs to be done manually due to a well-known limitation of the Revit API.

While the profile of the sweep can be locked to the model lines coming out of Dynamo, if extra rows are added, for example, the sweep will not be automatically updated to include the additional rows. However, the benefit of this workflow over Option 1A, is that the sweep will be ‘clean’ without any tessellations or triangulations. Furthermore, it allows for easy manual modifications outside of Dynamo.
If preferred, both Options 1A and 1B can be generated within a generic model family (but not a profile family). However, you will come across similar limitations, as mentioned above.
Option 2 – Revit Family Environment
In this scenario, we can use the ‘Stadium.ProfileCurve‘ node from the BVN package to create the sweep profile within a 2D profile family. First, create a new Family file by going File > New > Family > Metric Profile. Ensure that Dynamo is pointing to the new family file and not a Revit project. The script below will create detail lines in the XY plane of the profile family. Any manual modification can then be made as required, before loading the profile family into the Revit project.

Once the profile family has been loaded into the project, an in-place mass can then be created via a sweep. To do this, go Architecture > Build > Component > Model In-place, and set the family category to ‘Floors’. If the seating bowl profile needs to be updated in the future, simply re-run the Dynamo script in the profile family and reload (and overwrite) the family into the project. The sweep will then be automatically updated.

While this method is not necessarily the most parametric in the sense that you must go via the family first and then the project, it does afford the greatest flexibility for non-Dynamo users once the element is created. For this reason, this is the preferred option.
Step 5 (optional): Concourses & Multiple tiers
Stadiums will typically have multiple tiers separated by a concourse. A concourse is defined as a circulation area that provides direct access to and from viewing accommodation to which it may be linked by vomitories, passageways, stairs or ramps. It serves as a milling area for spectators for access to refreshments, entertainment and toilets, and may also be part of the entry and exit routes.
To create multiple tiers, simple repeat Step 4 but with new values. For example, while many of the values may remain constant, such as C-Value and seating row depth (T), the new tier will have a different point of focus (D) and initial N value (N). Note that although shown combined in this example, it is recommended to produce separate profiles as described in Step 4, for versatility.


Step 6: Vomitories
Section 9.1 of the Green Guide defines a vomitory as ‘an access route built into the gradient of a stand which directly links spectator accommodation to concourses, and/or routes for ingress, egress and emergency evacuation’ (p.75). Since the layout of vomitories will be different for each Stadium, this step is best done manually. To create the vomitories, first edit the seating bowl sweep created in Step 4/5, then go Create > Forms > Void Forms > Void Extrusion, and draw the vomitories in plan. The extrusion should be sufficiently high to cut through the sweep. You can create one void element with multiple vomitories or multiple voids, one for each vomitory – the choice is up to you.


Step 7: Gangways
Next, we need to add radial gangways to ensure spectators can travel from their seat to an exit. A radial gangway is defined as ‘a stepped or sloping channel for the circulation of spectators through viewing accommodation, running between terrace steps or seat rows’ (refer Section 8.2, p.66). The minimum width of a gangway should be 1200mm wide (refer Section 6.5, p.56 ) and all spectators should be within 12m of a gangway or exit, hence the maximum spacing of gangways 24m apart.

However, often the gangway distribution will be dictated by the seat spacings. Since the maximum number of seats per row is 28 seats (refer Section 12.16, p.119) and the minimum space allotted to each seat is 460mm (refer Section 12.13, p.116), this means the maximum gangway spacing is reduced to approximately 12.8m. Moreover, if the recommended 500mm seat spacing is used, the maximum gangway spacing is approximately 13.9m. In any case, the gangway spacings will usually be significantly less than the maximum 24m.

Gangways are best modelled as a single mass with multiple extrusions. To create these, go Architecture > Build > Component > Model In-place mass > Mass. Include any vomitories as essentially we are creating a void within the seating bowl where we don’t want seats. This mass will be used in the next step to create the seating line work.

Step 8: Seating row linework
Next, we need to extract the row curves of the seating bowl in preparation for the seat placement. One way of achieving this is to extract the edges from the seating bowl that we created in Step 4/5. However, this is an unnecessarily complex process as a series of sorting procedures would need to be undertaken to order the curves in a logical matter. Since we know the line of focus as well as the row offsets and Z-coordinates from Step 3, we can simply recreate the base linework. This method will give us a clean, structured list which will be easier to use.

When placing seats in a radial configuration, care needs to be taken in setting-out to prevent seats from overlapping. To achieve the desired spacing, we need to determine the front of the seat line. The ‘Stadium.CreateRows‘ custom node in the BVN package solves this though the ‘SeatDepth’ input. Essentially, the node offsets the back of row curve based on the seat depth input. The node then splits these curves with the gangway masses created in the previous step in preparation for the placement of the seats and gangway step generation.

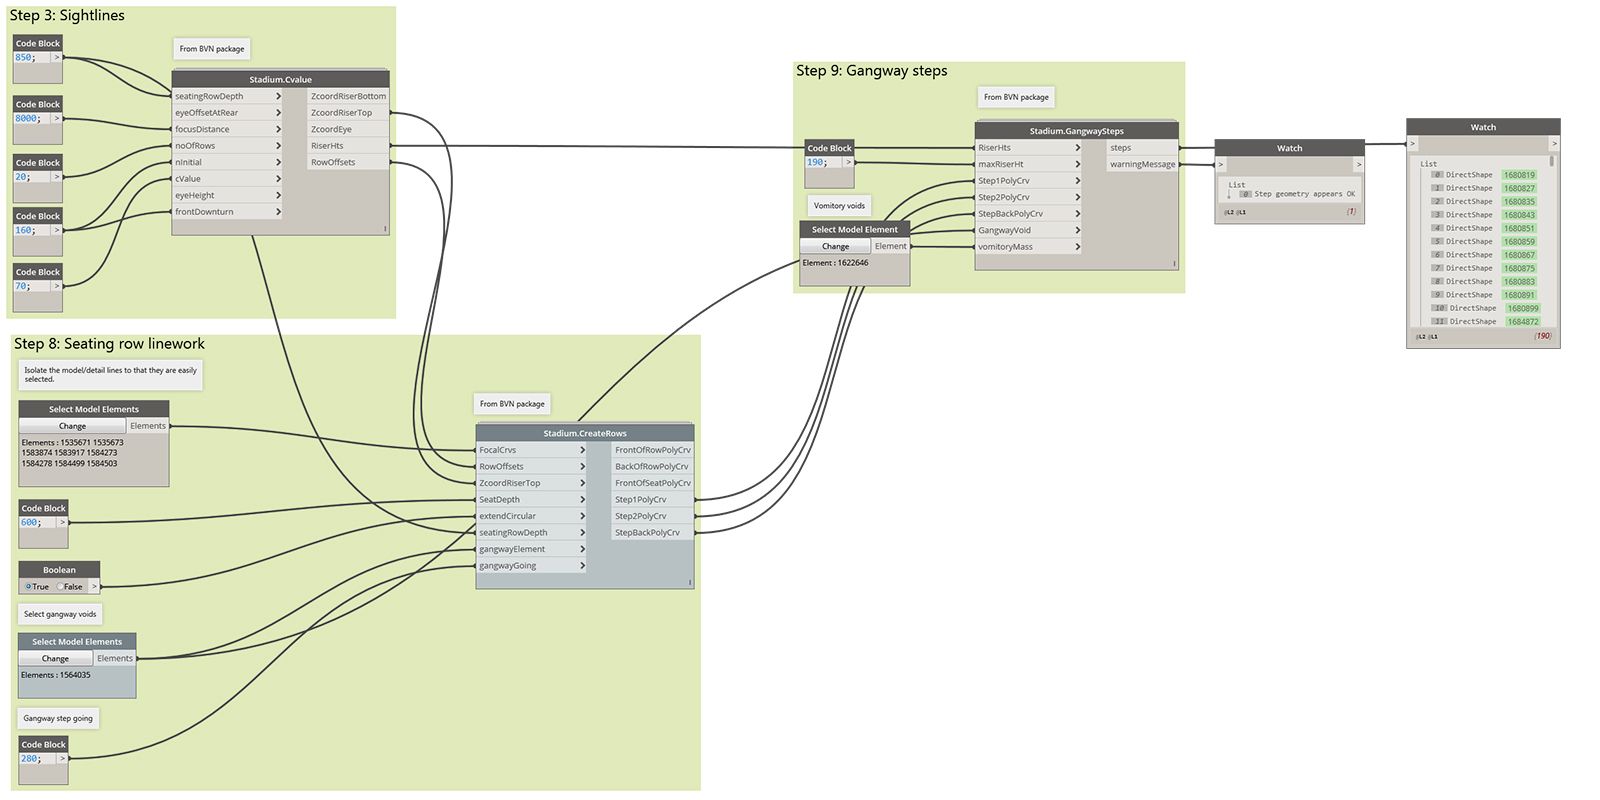
Step 9: Gangway steps
Using the curves from the previous step and the riser heights from Step 3, we can create the gangway steps. The number of steps will vary depending on the row riser height. Section 12.11 of the Green Guide (p.115) states that:
- The goings of steps in radial gangways should not be less than 280mm and should be uniform.
- The risers of steps in radial gangways should not be more than 190mm, and should also be uniform.
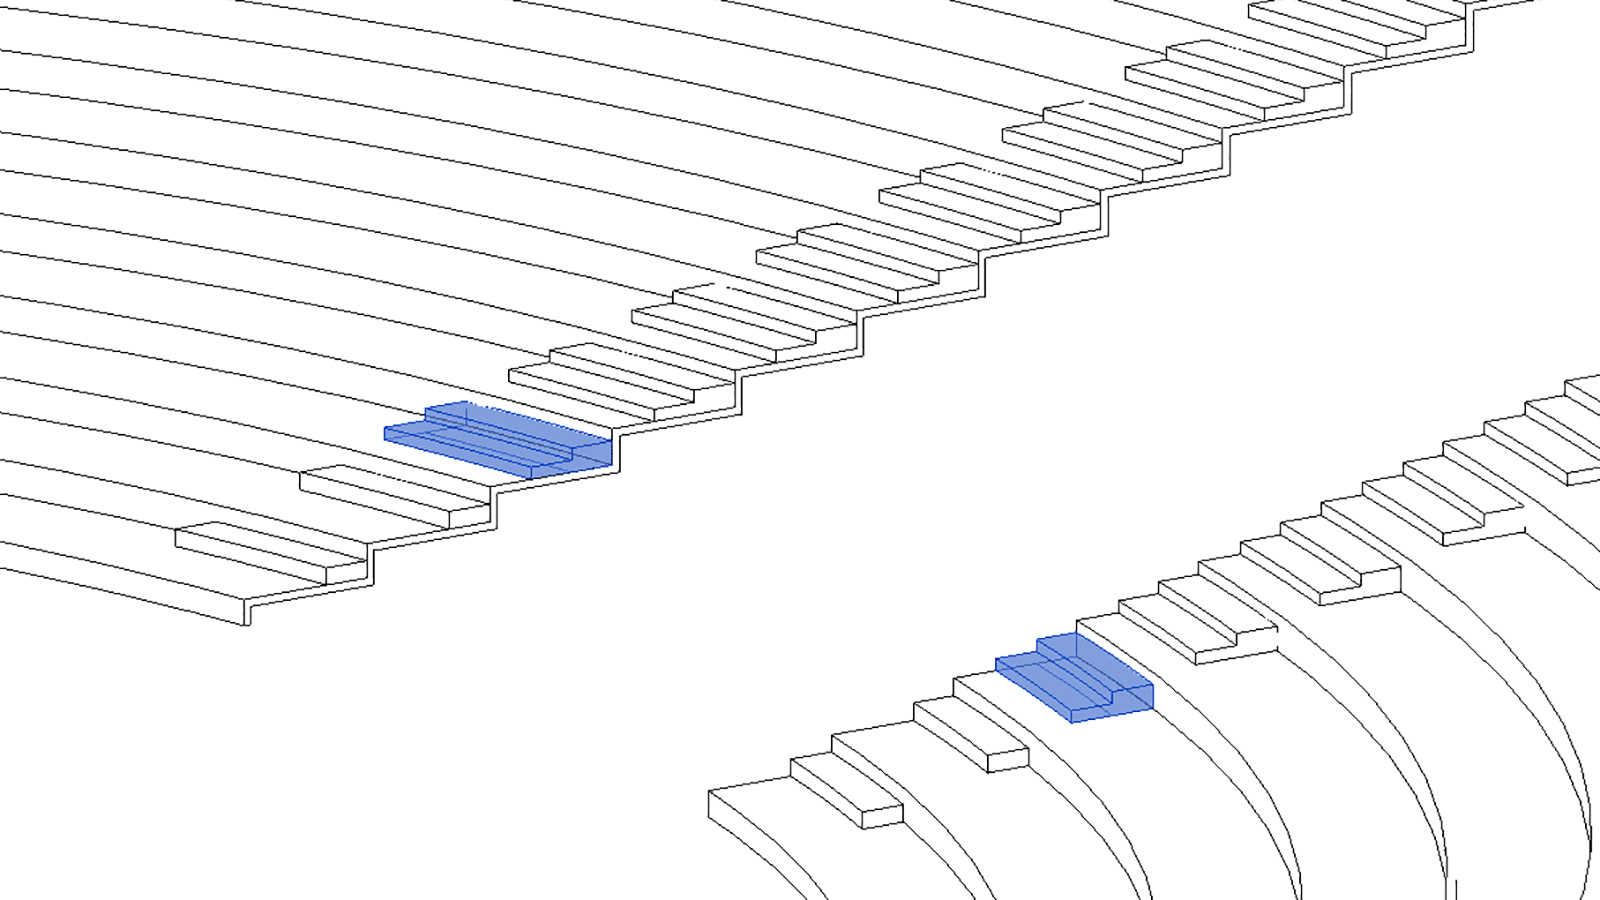
A conditional statement is therefore required which states that if the going between rows is greater than the maximum step riser (190mm), then a step is required. Next, calculate the riser height of the step and determine if it is greater than the maximum (190mm). Repeat this process until the riser heights are below the maximum. To simplify this process, use the ‘Stadium.GangwayStep‘ node from the BVN package. The node will create uniform steps where the gangway voids existed (refer Step 7) which is then automatically cut by the vomitory voids (refer Step 6). To be able to select the vomitory void form for the ‘select model element’ input, you’ll need to edit the seating bowl sweep so that the void form is available.
Step 10: Place seats
The final step in creating our seating bowl is to place the seats following specific criteria:
- Justified to the edge of the gangways;
- Equally spaced between gangways; and,
- Perpendicular to the row.
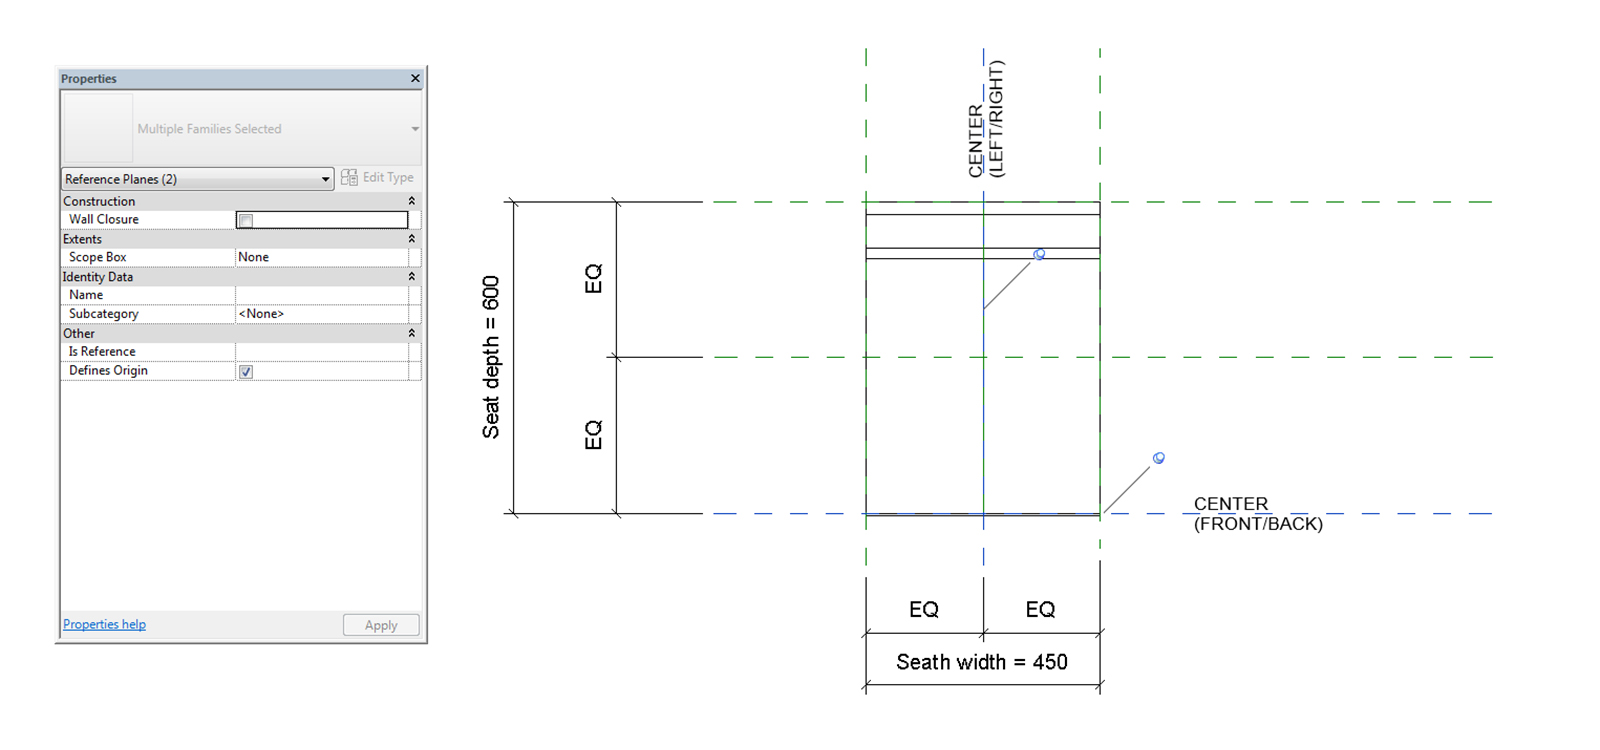
Seat family
Before we place any seats, we need first to ensure our seat family is correct. When placing a family in Dynamo, Revit will use the insertion point as defined by the ‘Defines Origin’ parameter within the family. The example below shows how the reference planes have been modified and renamed so that the centre (front/back) and centre (left/right) align with the front of the seat.
Seat family rotation
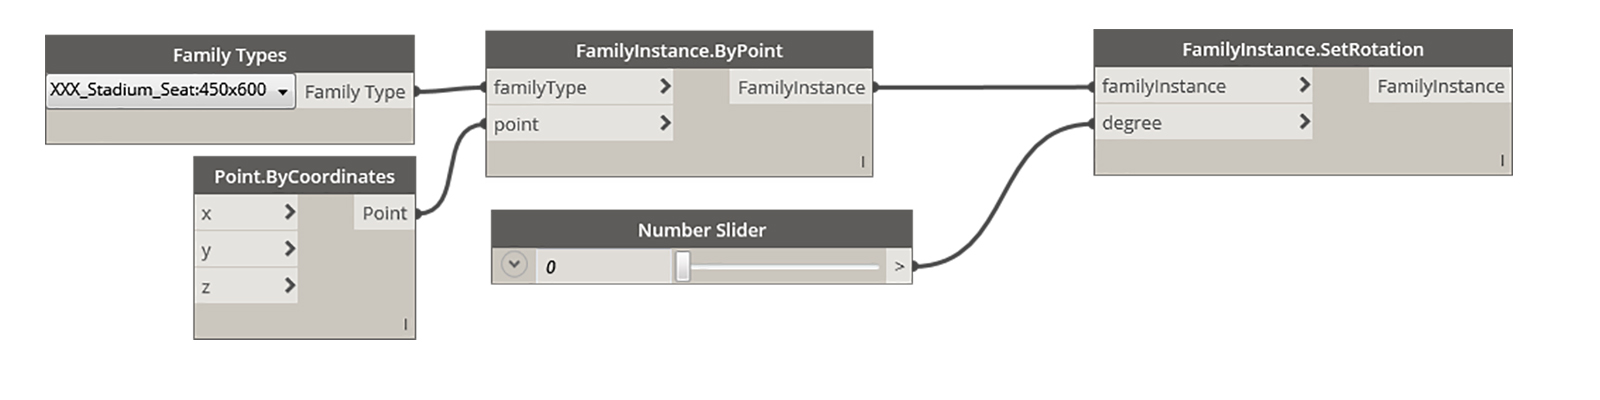
When rotating a family using Dynamo, Revit will use the local Z-axis regardless of where you have defined the origin. To check that the rotation point is the same as the insertion point, create a point at 0,0,0 in the family using the ‘Point.ByCoordinates’ node and ensure that the Revit background preview is enabled. Alternatively, you can load the family into the project and check the rotation there using a simple script:
Place seats
Once you are happy with your seat family, ensure it is loaded into the project. To place the seats, we can use the front of seat polycurve generated in Step 8 and the ‘Stadium.PlaceSeats‘ node from the BVN package. The polycurves already accommodates any gangways or vomitories, so there is no need to do any further modification to the base geometry apart from removing the last row.

The node calculates the start and endpoint of our seating array. If we were to use the start and endpoint of the polycurve, we would have seats encroaching into the gangways, which is unacceptable. We, therefore, need to ascertain the seat width and trim the polycurve by half of the seat width at either end. This process will ensure that seats are justified to the gangways.
Seat location
Next, the node divides the shortened polycurve by chord length (as opposed to along the polycurve) using the minimum seat spacing. This operation returns a preliminary result as it will generally be a number (float) rather than an integer. Since we can’t have part of a seat, the node uses the ‘Floor’ node to round down the number to the nearest whole number. Knowing how many whole seats will fit, the node then divides the shortened polycurve with the new integer value. The resultant points on the curve are the insertion point for our seat family which corresponds to the front of the seat. Note that the number of seats per row between gangways is going to differ. This scenario is most evident in the corners of the stadium where there is radial geometry.
Since it is not possible to place a family instance with the correct rotation in one step, the node first places the seats using the ‘FamilyInstance.ByPoint’ node before setting their rotation. The seats need to be rotated so that they are perpendicular to the normal along the rows. To calculate this angle, the node uses the insertion points of the seat family and the polycurves to generate the parameters along the curve using the ‘Curve.ParameterAtPoint’ node. With these values, normals are then returned using the ‘Curve.NormalAtParameter’ node.
Seat angle
Next, we need to calculate the difference between the orientation of the seat family and the normal vector. Before Dynamo 0.8.2, this was impossible using OOTB nodes. However, Dynamo now has the ‘Vector.AngleAboutAxis’ node. Since in this example, the seat has been modelled facing ‘down’, I need to compare the normal vector to the negative Y vector. The result of this calculation is the required seat rotation in degrees from 0 to 360. The seats are then rotated to the correct orientation using the ‘FamilyInstances.SetRotation’ node. The ‘Stadium.PlaceSeats’ node will also output the total number of seats and the number of seats per row so that you can ensure all brief and regulatory requirements are met.

Final thoughts
While this tutorial demonstrated that it is possible to create a seating bowl using Dynamo parametrically, it highlighted the fine line between the desire to achieve full automation verse the usability of the output. In this scenario, a fully parametric definition would have been detrimental to the workflow due to the inability to edit direct shapes manually. Instead, an augmented workflow was advocated, which afforded both manual intervention and more usable Revit geometry. Computational designers must be aware of such software limitations and ensure they customise their workflow appropriately so that the entire project team can engage with the model.
To see how Dynamo can be used to create an entire stadium, check out this post.
Reference
Department for Culture, Media and Sport (2008). ‘Guide to Safety at Sports Grounds’, The Stationery Office, Norwich.


44 Comments
David Baldacchino (@dourevit)
Awesome writeup mate!
paulwintour
Thanks David. Glad you liked it
Bernard Hermens
Awesome tool for design. Maybe not the best for construction documentation but WIP (comments)
Jose Galindo
Great tutorial, thank you for putting this together. Is there a way to make this work with imperial units?
paulwintour
Hi Jose. I believe it should work but i haven’t tried. I don’t believe there are any nodes inside the custom nodes that should cause problems. Did you try?
Christian Gentry
Greetings Paul,
I am working with Jose through this tutorial and I have also had trouble getting the nodes to work with imperial units. We are using imperial units, with the base unit being feet in our project and the output values are not correlating to what we input. For example, when I convert your mm units for the cvalue node, (850, 8000, 20, 160, 70) to feet (2.8, 26.25, 20, .525, .23) our output values do not match up as would be expected. Here is an image link with an example https://imgur.com/a/stnCw
We have also tried going into the Cvalue custom node and converting the input values to imperial units with no luck. Would it be possible for you to help me understand how to proceed in order to get this package working with imperial units? I appreciate the tutorial and the help.
Thanks
paulwintour
Hi Christian. The problem is that you have left both the ‘eyeOffsetAtRear’ and the ‘eyeHeight’ inputs blank. I Ieft these blank as they have default values assigned to them within the custom node, 150mm and 1200mm respectively. You’ll need to explicitly state these values if you are using feet. If you enter 0.49 into ‘eyeOffsetAtRear’ and 3.93 into ‘eyeHeight’ it should work fine.
Christian Gentry
I just put in the new inputs that you suggested and the values are coming up the same (slightly different due to rounding).
https://imgur.com/a/oeibY
Could there be anything else that would be causing this to occur?
Thanks again!
paulwintour
Everything looks fine except for the riser heights, correct? I believe the issue is the cValue input. It is after an integer (whole number like 70). We are feeding in 3.93. If you modify the custom node input and remove the ‘: int’ we’ll be able to enter in a double (decimal number). So it should just look like this:
//C value (C)
cValue
Let me know if that fixes the issue.
Christian Gentry
I can’t reply to your comment below this one so I am replying up here. Your suggestion worked! By switching from int to double my values are matching up with yours. Thanks!
Christian Gentry
Greetings Paul,
I have been moving along with your tutorial using a metric template in order to keep making progress. I am at the stage of the tutorial where I need to add steps to the seating bowl. I am confused about how some of the inputs are being labeled. Would it be possible for you to explain which elements are being referred to when calling out (gangwayElement, GangwayVoid, and vomitoryMass)? Here is an image showing which elements I am referring to in my file, https://imgur.com/a/iYIWR
I am working inside of a single component. There are two sweeps, one for each seating level, and there is a vomitory void mass and a gangway void mass. I run the script while closed out of the component.
Please let me know if you need any more information about my model. Thank you again for the help, this package seems quite amazing.
Thanks
paulwintour
Hi Christian. What do you mean by a single component? Do you mean a family?
The ‘gangwayElement’ and the ‘gangwayVoid’ are the same object. Sorry this is confusing. This object defines the aisle. The ‘vomitoryMass’ is the cutout of the seating bowl. You definition looks OK. However you need to manually cut the seating bowl with the vomitoryMass (refer step 6). We only select it later so that we can get the boundary of the vomitory to generate the steps. Is that clear?
Christian Gentry
That is clearer, thank you. And yes I meant family, sorry for the confusion. I have cut out the vomitories from the seating bowl by using a single void mass with multiple extrusions. This mass is what I have selected as the vomitoryMass in the node. I have also created the gangway mass element and it is the input for the GangwayVoid and gangwayElement. However, once I run the script, I get this,
https://imgur.com/a/KpJjR
This is a link to my file and dynamo script if that is useful!
https://drive.google.com/drive/folders/1etfZQbyzlHc0jsQE7_a0iXGaE5tuYAc5?usp=sharing
Thanks
Christian Gentry
I forgot to mention, the mass is labeled as Mass 2 in the file and has to be re-added from the family list once the file is open. Sorry about that
Christian Gentry
I am noticing that the riser heights are not consistently spaced once the profile is created. Wouldn’t risers need to ascend the seating bowl at a constant rate in order to maintain walk-ability? I may not be understanding this part correctly but it would seem to me that all riser heights need to be a constant height, 300mm for example. Please help me understand if I am missing something.
Thanks
paulwintour
Hi Christian. What is this model for? Where are you based? This tutorial is based on the UK standards called the ‘Green Guide’. All stadiums are parabolic (although some get rationalised later). This means that it is impossible to have constant riser heights and why special regulations exist. It is not deemed a ‘stair’ but rather a ‘gangway’. As such it is only necessary to have the same riser heights between rows, not for the full extent of the gangway. As long so no individual riser is below or above the limits, its acceptable. If you want a constant riser height, there is no need to use the cvalue calculations.
Christian Gentry
Hey Paul,
I am using this model as a learning exercise to see how Dynamo can be utilized within design. I am an emerging professional in the U.S. so I am still learning a lot about specific design considerations. I was able to reference the Green Guide about gangways and I found exactly what you mentioned in your post. I compared the output of this script to an existing stadium’s construction documents. I saw that the existing stadium had constant riser and seating heights so I became confused as to why that was the case. It now makes sense that with the C Value being constant would cause differentiation between seating heights. My best guess in regards to the existing stadium that I referenced is that the seating height was constant while the C value was operating within a certain tolerance. I think you were able to answer all of my questions. I really appreciate how helpful you have been! This script is truly incredible and well documented, I have learned a lot from it. Thanks again!
Beau Beashore
Thank you for the great tutorial!
One step that I can’t figure out, though I think the answer is probably right in front of my face.. what do I select for the “Select Model Elements” component at the front end of the bowl script?
paulwintour
Hi Beau. Are you referring to Step 4- option 1A? If so, it is the line of focus (model lines) created in Step 2.
Beau
Perfect. I’ll give that a try! Thanks!
Himanshu Vaid
Hi, can someone please help me find the “Stadium.Cvalue” node. I am currently using the Dynamo Revit 1.3.3.4111 version.
This is my email id – himanshusquare@gmail.com
paulwintour
The BVN Dynamo package
Tomas Strnadel
First, thank you for a great tutorial.
I have a problem with the Step 8 – Creating a seat row line. For some reason my “Stadium.CreateRows” node doesn’t work. The whole process went without errors, but the output of the node is full of nulls. Difference is that I am using a regular masses for the gangways, because I am not able to switch it to voids without cutting anything. And idea of my tribunes is, that they are accessible from above (first tier), so I don’t really need many vomitories, except for players.
Does someone know what am I doing wrong, please?
https://imgur.com/a/WP0a48G
paulwintour
Thomas can you upload your file. It is also useful to share what version you are using (Revit, Dynamo and the package). The latter stages of the stadium are a bit tricky and depending on how the geometry was built, the node can fail. If you want to test yourself, you can copy and paste the contents of the custom node into the graph (as you can’t debug from with the custom node!). Then you can check for warnings.
Tomas Strnadel
Thank You for reply.
Well I am using Revit 2018.2 with Dynamo 2.0.2. and BVN 1.6.1. package. These are my files: https://file.io/cm2jVe I think there might be a problem inside the BVN nodes. Concretely in the CreateRows one. When I try to edit this one, there is an unresolved node from Lunchbox for sorting points along curve. It is confusing, because I have the Lunchbox package installed and more, it looks that the data from the sorting node are not used further in the CreateRows node. It seems to me that there is one small problem hidden somwhere, otherwise I have everything ready to work. 😀
Tomas Strnadel
I see the link with my files suddenly stop working. Here is another one: http://mysharegadget.com/609677880 Sorry
paulwintour
Hi Thoman.
The CreateRows node is working for me with your files. Are you sure you have Lunchbox properly installed? Not sure why you are getting an unresolved node.
Looking at your file, one thing I would suggest is to make the gangway masses bigger than the vomitories. Otherwise you can’t actually access the seats. Step 9 is where things can get a little fiddly. The node is quite sensitive to the gangway mass and how it cuts/intersects the step polycurves. This can cause the gangways steps to go crazy and form diagonal across the stadium.
BrianParish
Thank you for the tutorial and the packages. I am having issues with the gangway steps being created upside down. I’m working with imperial units if that makes any difference.
paulwintour
Hi Brian. Are you able to upload a link to a file or image? Without it it’s near impossible to troubleshoot. I can’t see anything in the node that would cause imperial units to fail, but I haven’t tested it.
Brian Parish
After looking at this again today, there was an update to Lunchbox that seems to have fixed the issue.
paulwintour
Great. Thanks for letting me know
Kwan
Hi, Like this tutorial. But also got “null” result in Step 8. Uploaded the files to https://drive.google.com/drive/folders/1jeAKCCxs6vBUJa2WVLqdq8tOZnig5tQ4?usp=sharing
May I know if anything wrong?
Paul Wintour
Hi Kwan. Can you provide some more details like what Revit and Dynamo version you are using.
Joseph Lee
I recently came across doing a Dynamo exercise very similar to the one above. I also tried to use the C-Value formula above found in Google search. After I plugged some testing numbers to different equations and Revit, I found the equation above has flaws. It was derived by the incorrect assumption that the C-Value belongs to the person at front. In fact, the C-Value is a vertical distance from the front person’s eye to the sightline of the person behind. The difference in the two equations changes the calculation a little. It is a widely circulating formula. I found a possible origin. It was a class exercise from the University if Bath back in 2012.
Joseph Lee
I found the equation was referenced from the UK’s Green Guide (you said in another post). The graphic in the Green Guide section (2008 version Page 109) shows the ‘D’ horizontal distance is measured from the focal point to the ‘Eye’ stopped at the front person rather than the person behind who starts the eye sight dashed line. The flawed assumption changes the math algebra a little. I created a section in Wikipedia – Sightline with graphic reference to explain the math. The revised equations test C-Value results match the measurement in Revit.
Paul Wintour
Hi Joseph. I’ve thing you’ve missed understood the formula. It all looks fine to me.
And even if there are flawed assumptions in the equation, the Green Guide provide a standardised way of measuing sightlines.
Joseph Lee
I do understand the formula is in the UK’s Green Guide. Projects in UK and the Commonwealth will need to follow the standards. I am a UK citizen working in an American sports architecture firm. The formula wasn’t a problem until the computational design become popular. It is more a discussion of math and geometry than who created the standards. When I run my Dynamo graph using the Green Guide formula, it is off a little.
The existing formula solved the C-value at the wrong location (see image in the link). However, the Page 109 in the Green Guide does show the correct graphic reference. The C-Value is in front of the Viewer’s eye, not above the Viewer’s eye.
https://photos.app.goo.gl/TsDMAhJoQsyrAyvm8
Just a discussion.
Paul Wintour
I’m sorry Joseph, I have to disagree. If your Dynamo graph is giving the wrong results, it is likely your graph, not the formula. The c-value is consistent (or should be) from row to row. Running my graph, I get correct results…
Frank niyonkuru
Thank you for sharing this information with us, it really helps me a lot because I have to design a project for a football stadium, so sometimes to get this kind of information it takes more research time.
Paul Wintour
Your welcome
Adil
Hi Paul I see you referencing this package you use it’s called BVN 1.6.1. package where can i access this package i am currently working on a project which requires me to look at a stadium do you know any other references i can follow like size of a pitch etc..
Thank you again appreciate it
Paul Wintour
You can access all packages, including BVN, via the Dynamo Package Manager. However, I’m no longer developing it and it hasn’t been updated for several years so you’ll need to do the upgrades yourself. I hope that helps.
Edward RR
Hi Paul, any chance you could provide the python script that instead of increasing value for Z, it is decreasing? I’d like to adjust the script instead of beginning from the front plat upward, it will generate from the back downward.
Adil
Just wanted to ask if you still have that file that you did for this tutorial if so would you be able to share it. Thank you