

In this previous tutorial, it was demonstrated how to achieve the requirement of calculating a ‘direct beam of radiation from the sun’ for the purposes of solar access. However, most environmental analysis software use illuminance-based analysis where results depend on how much light bounces off the interior surfaces of your model, the glazing transparency, and the sky model specified. This tutorial therefore explores how to use Autodesk’s Insight to run various illuminance-based lighting analyses and discusses its limitations for calculating solar access.
Background
Insight is broken down into two parts – lighting and solar – and is based on the underlying analysis engine. Anything under ‘Solar’ uses the Perez sky model calculation for solar insolation and is beyond the scope of this tutorial. Conversely, anything located under ‘Lighting’ uses the A360 rendering engine and is an illuminance-based analysis.
Illuminance is a measurement of light striking a surface and is expressed in footcandles in the USA (based on square feet) and in lux in most other countries (based on square meters). Results of illuminance-based analyses depend on how much light bounces off the interior surfaces of your model, the glazing transparency, and the sky model specified.
Before running an Insight analysis, you’ll need to login to your Autodesk account and have access to cloud credits.
Step 1: Install Insight Revit plugin
Firstly you’ll need to download and install the Insight plug-in for Revit. Currently, it is available for Revit 2016-2020. Once installed, it will appear under your Analyze Tab.

Step 2: Set project location
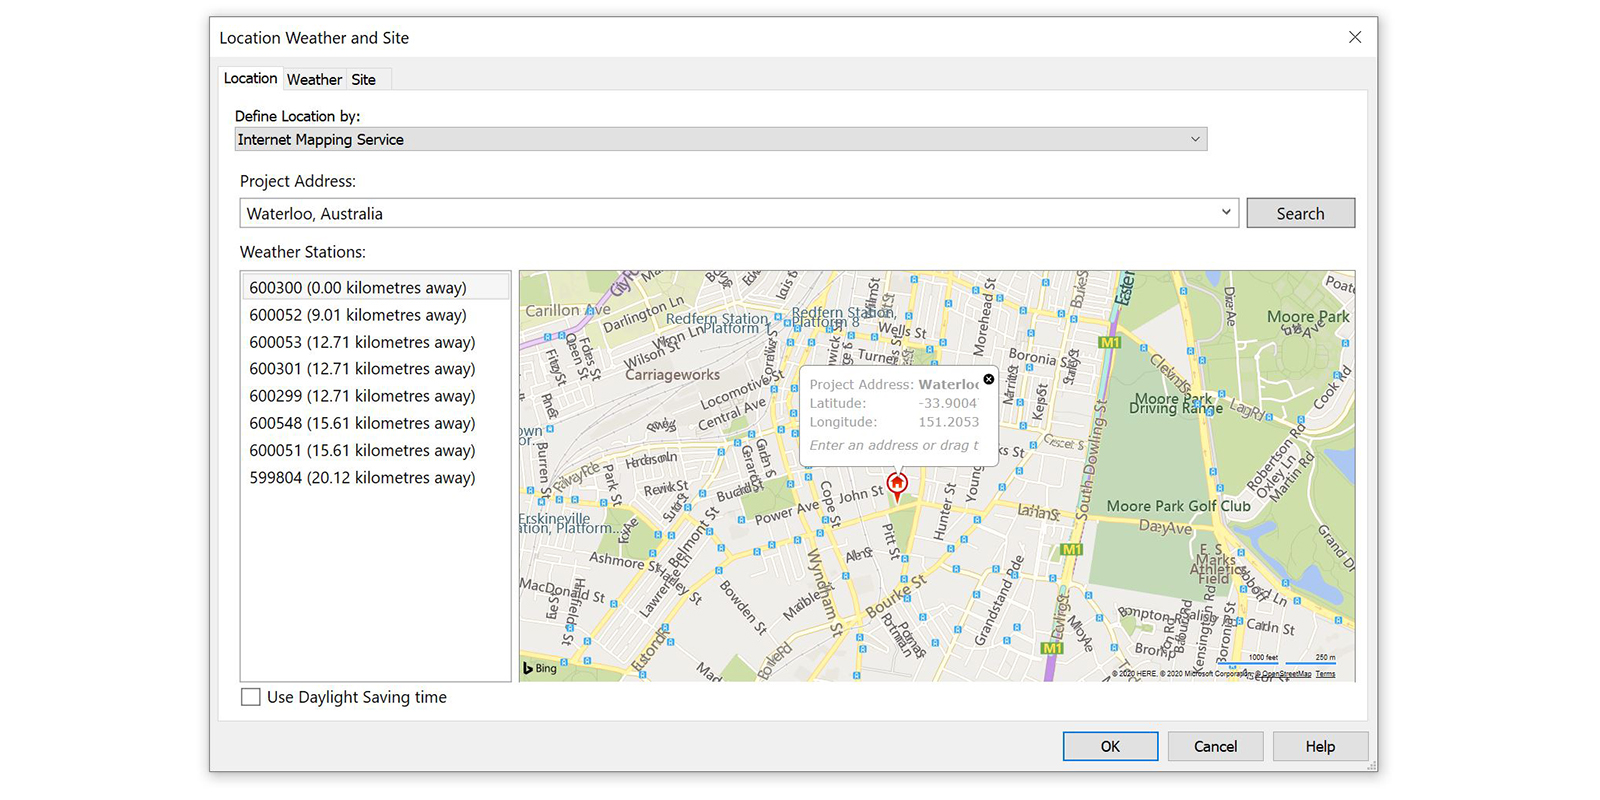
Next, ensure that you set your project location accurately. Go Manage > Project Location > Location. Alternatively, you can also access it by going Analyze > Energy Optimisation> Location.
Step 3: Prepare your Revit model
You’ll need to use building elements for the analysis. Note that masses will not work, and you must have floors and rooms specified in your model and these need to be part of the main model, not linked in. It is also essential to verify that all rooms are properly enclosed; otherwise, they won’t be processed.
Next, ensure you have defined the reflectivity of opaque materials. This process can be a time-consuming task, and you may prefer to purge all unused materials first to ensure only the necessary materials are modified.
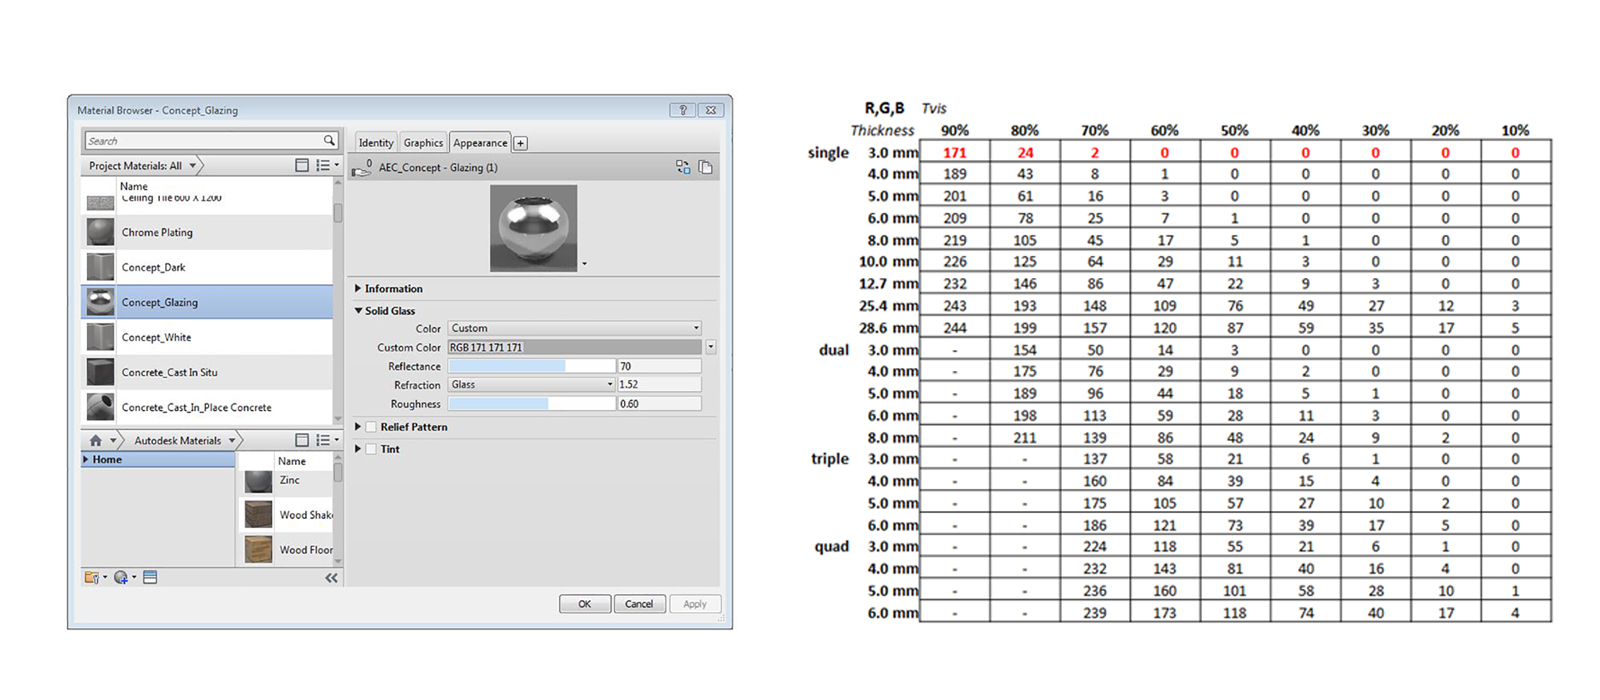
Next, it is essential to set valid glazing properties. Autodesk claims that the default setting for glazing transparency (visible transmittance, or TVis) in most glass nested within window families are generally much higher than glass typically used in buildings today. Setting valid glazing properties is vital for getting valid illuminance simulation results. Alternatively, if you want glazing to have no impact on the analysis, glazing elements can be removed by hiding in view before uploading the model for analysis (refer Step 4).
Step 4: Set-up analysis
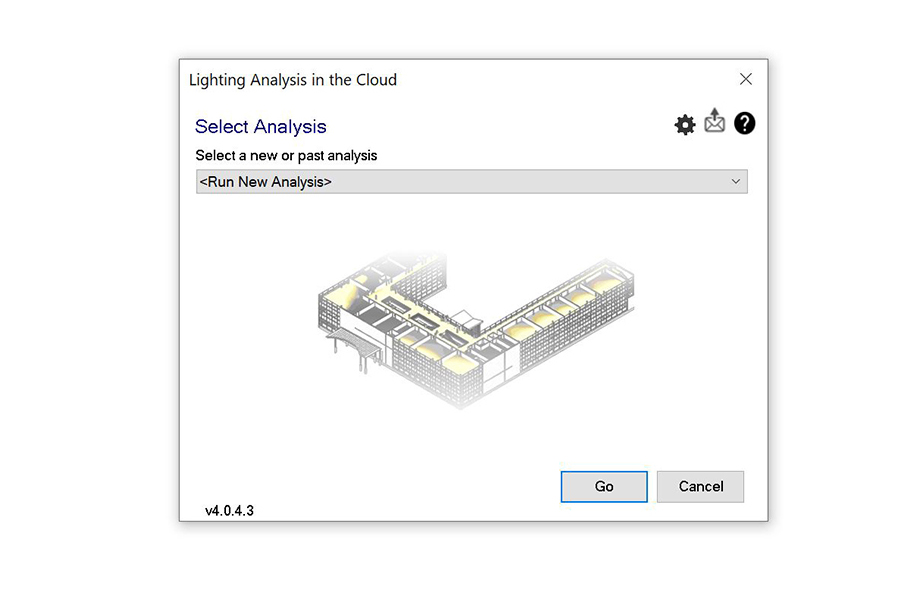
Next, go Analyze > Insight > Lighting and select ‘run new analysis’. Insight will automatically create a 3D view called ‘_InsightLighting Model View’ and a room schedule called ‘_InsightLighting Room Schedule’. Note that only the elements visible in ‘_InsightLighting Model View’ will be analysed.
Next, you’ll need to set the analysis type. As of Revit 2020, there are seven options available.
Step 4A: Illuminance analysis
The illuminance analysis option allows you to fully customise your analysis. However, the minimum resolution grid is 12 inches (30cm).
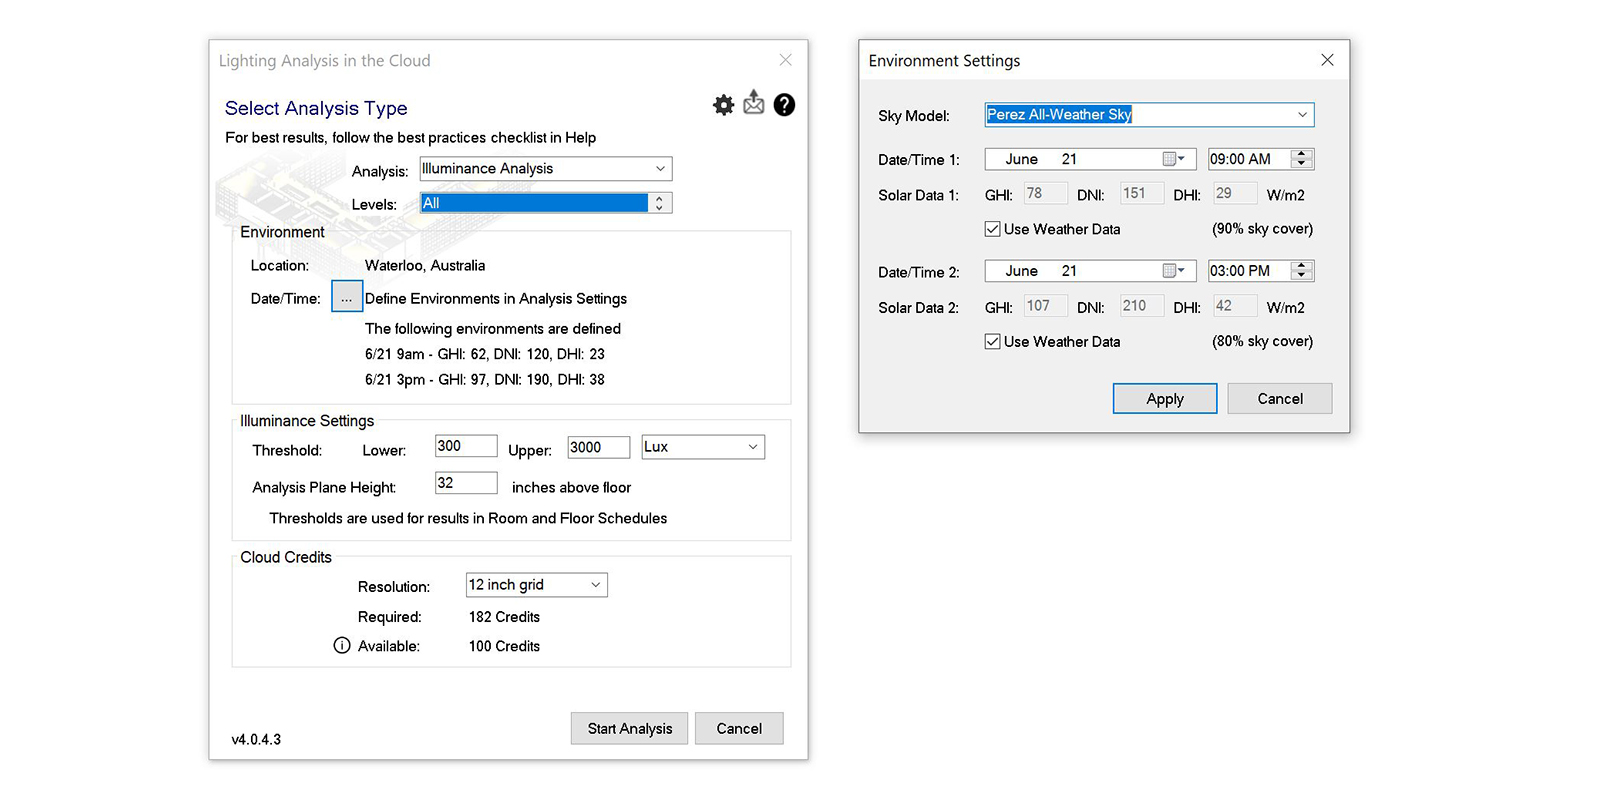
Press the ellipsis beside date/time to bring up the environmental settings. Define the date/time as required. Be aware that the year defaults to 2010. When defining the sky mode, there are several options:
- The Perez sky model is the most used in daylighting simulation applications and the model most analysts use in Radiance. The Perez model yields accurate results for all sky types from clear to fully overcast. It is also the model LEED requires to be used for daylighting predictions.
- The CIE models are essentially simplified and standardised instances of the Perez model. They provide standard conditions for daylighting applications (Overcast sky, Intermediate sky, Clear sky, and Uniform sky). If you know what kind of sky you will have, or you’re trying to get values for a particular situation (clear or overcast), then it is a good idea to use a CIE model.
- When you choose the Daylight Factor Sky, your results will be expressed as a percentage. This number is the percentage of natural light falling on surfaces compared to that which would have fallen on a completely unobstructed horizontal surface under same sky conditions. The location or time of day does not matter if you are using a Daylight Factor Sky.
You also have the option to specify the sun’s intensity by entering irradiance values: Direct Normal Irradiance (DNI), Diffuse Horizontal Irradiance (DHI), and Global Horizontal Irradiance (GHI). Alternatively, you can enable ‘use weather data’ which will use weather data from the closest weather station to your defined location (refer Step 2). For more information on sky models and irradiance values, refer here.
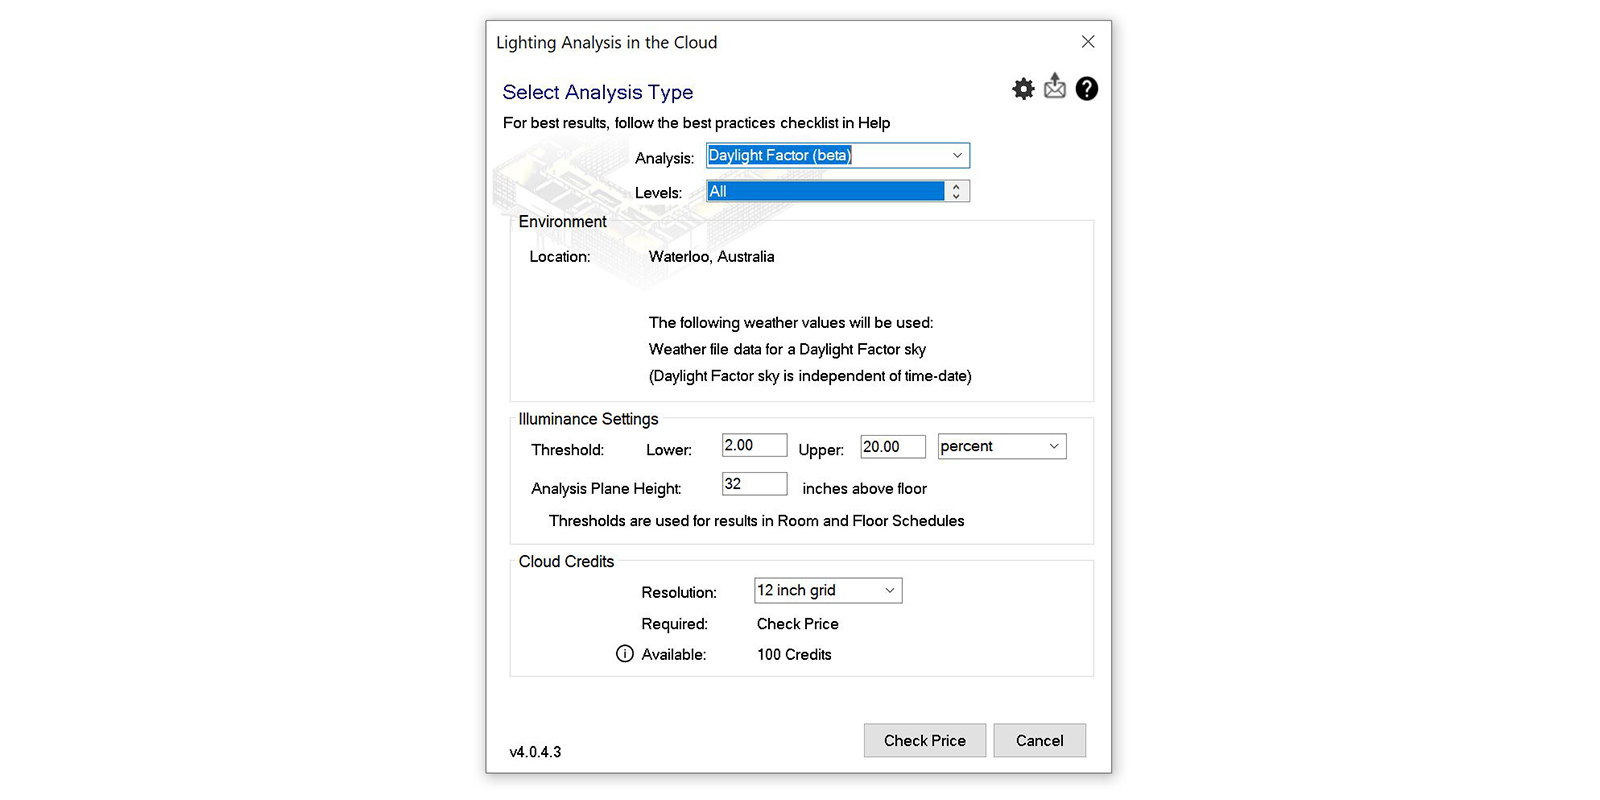
Step 4B: Daylight factor (beta)
Daylight Factor expressed results as a percentage. This number is the percentage of natural light falling on surfaces compared to that which would have fallen on a completely unobstructed horizontal surface under same sky conditions. The location or time of day does not matter if you are using a Daylight Factor Sky. The analysis plane height defaults to 32 inches (81cm) but this can be set between 1 and 99 inches. The minimum resolution grid is 12 inches (30cm).
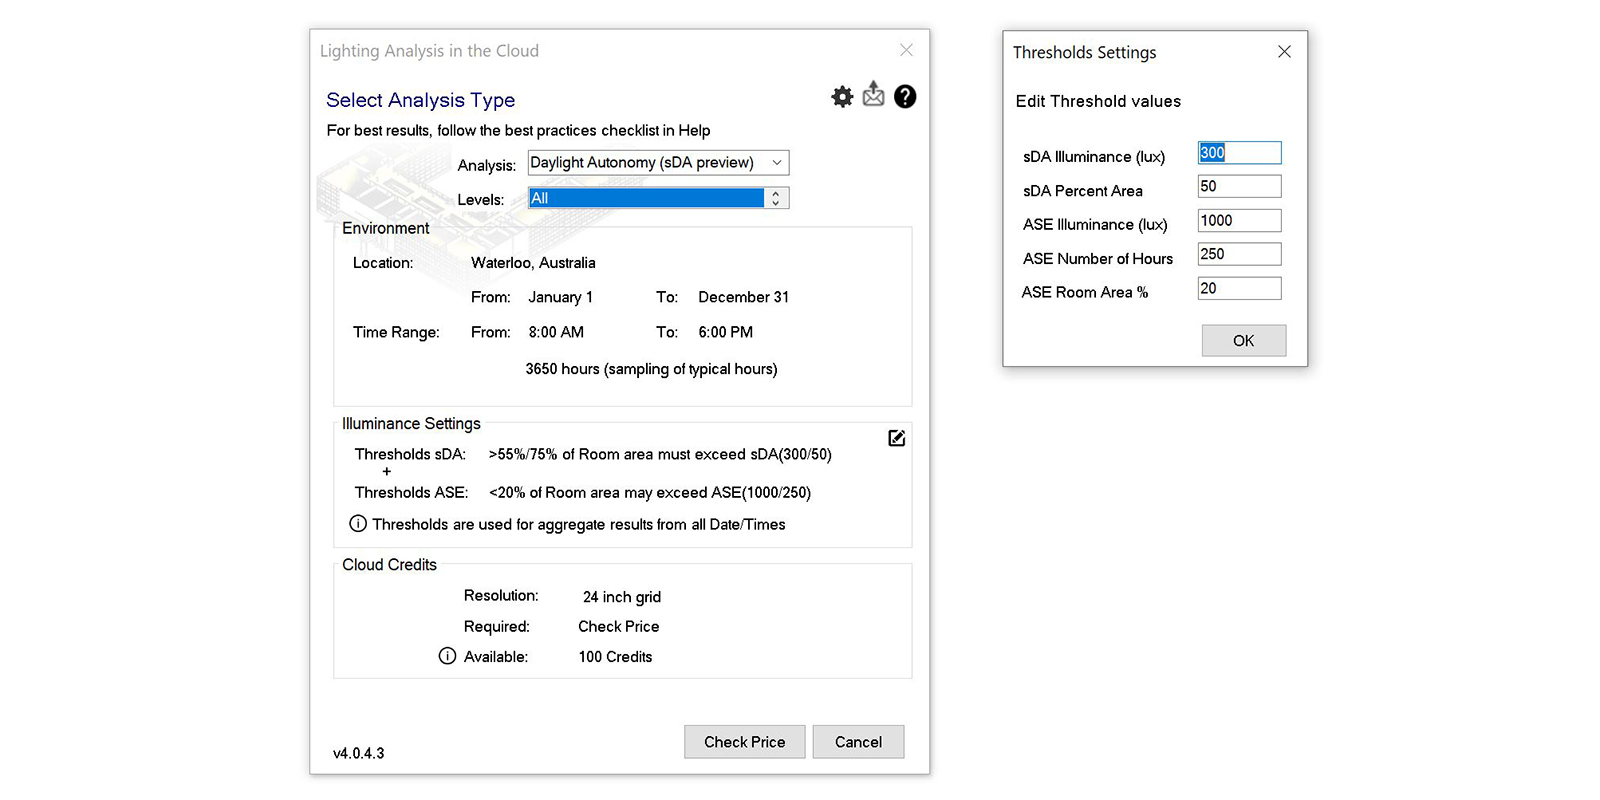
Step 4C: Daylight Autonomy (sDA preview) analysis
Spatial Daylight Autonomy (sDA) examines whether a space receives enough daylight during standard operating hours (8 am to 6 pm) on an annual basis using hourly illuminance grids on the horizontal work plane. Floor areas, or grid points, in the building model that achieve 300 lux for at least half of the analysis hours count as meeting the daylighting threshold. As a result, sDA values can range from zero to 100% of the floor area in question. The resolution grid is 24 inches (61cm).
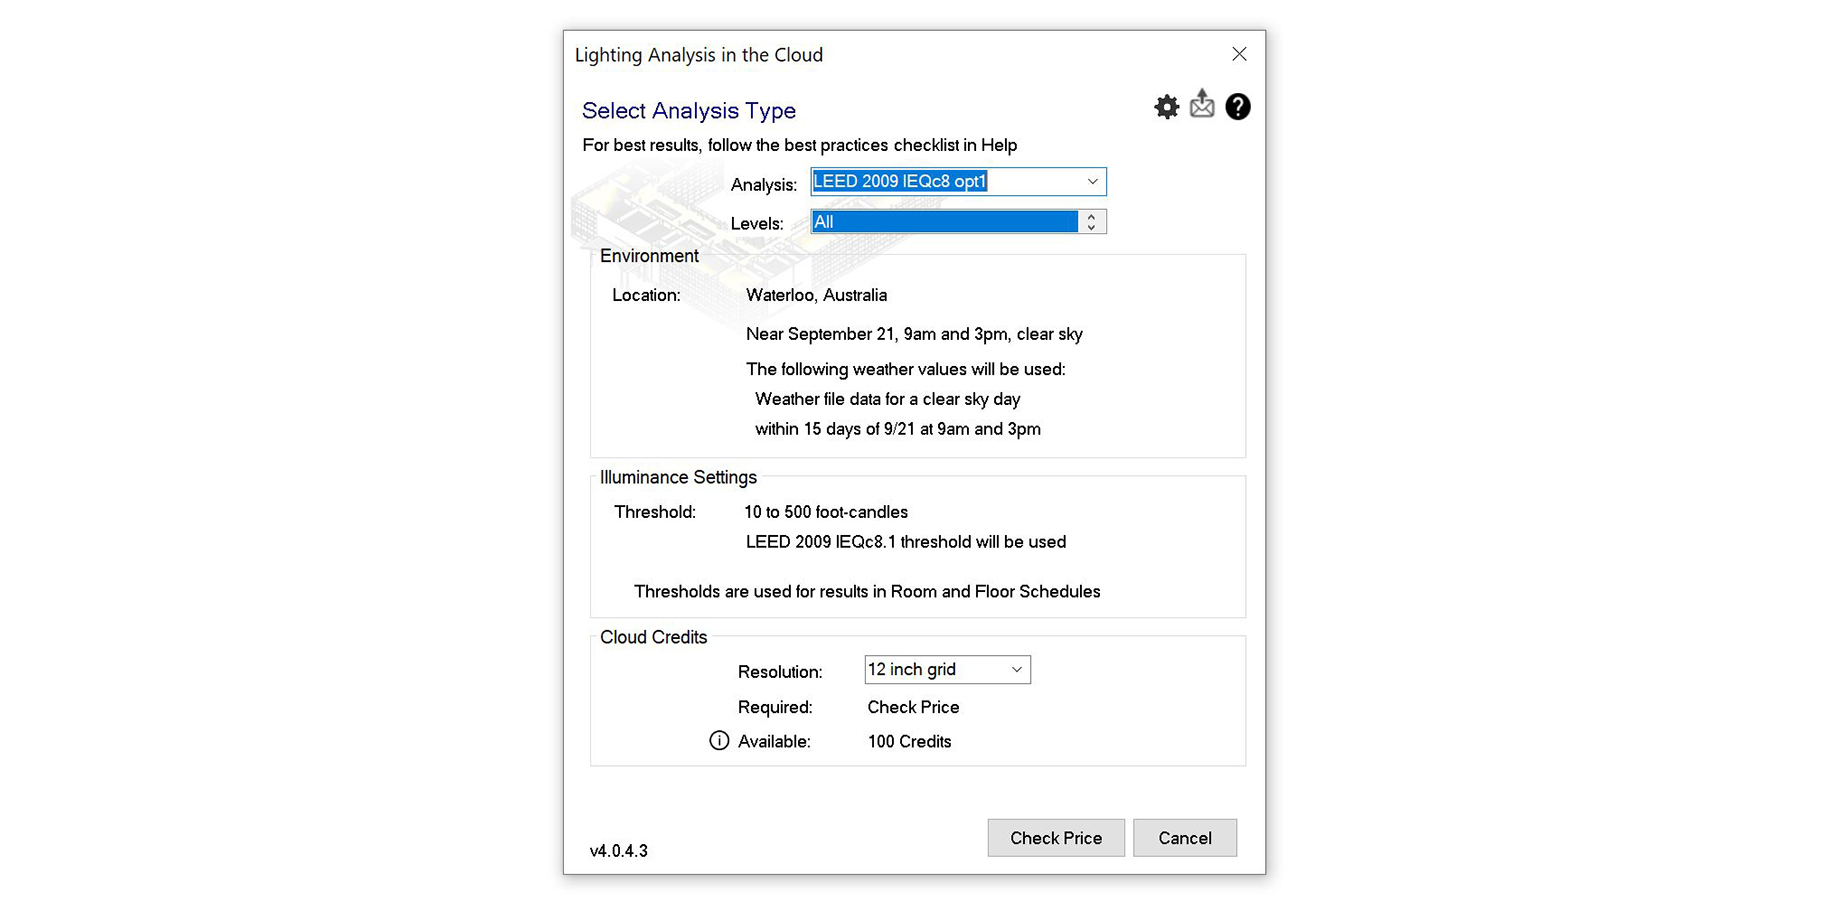
Step 4D: LEED 2009 IEQc8 opt1
This analysis checks that the applicable spaces achieve daylight illuminance levels of a minimum of 10 fc (108 lux) and a maximum of 500 fc (5,400 lux) in a clear sky condition on 21 September at 9 am and 3 pm. The minimum resolution grid is 12 inches (30cm).
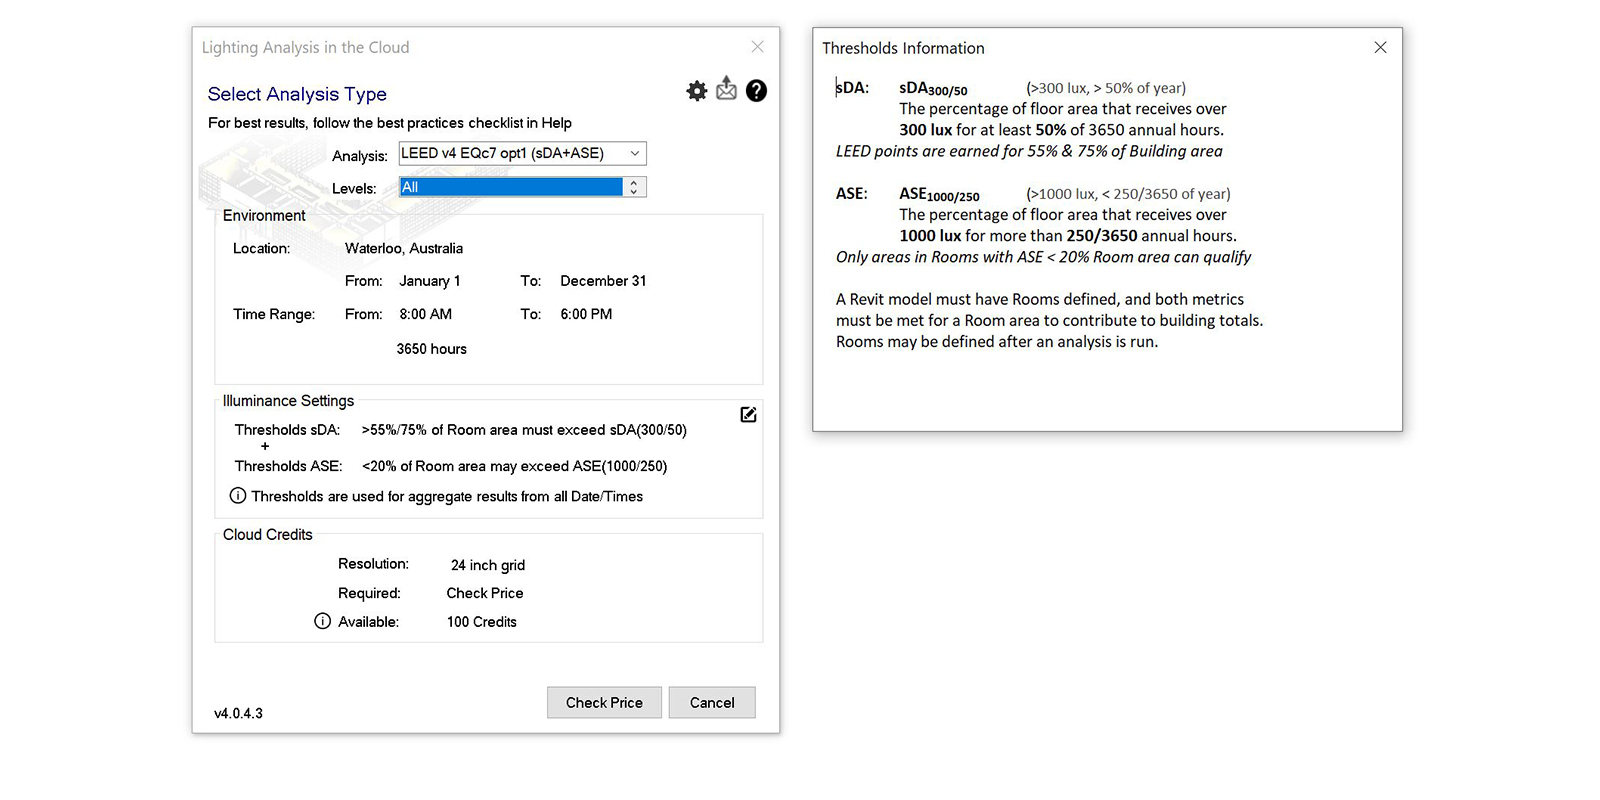
Step 4E: LEED v4 EQc7 opt 1 (sDa+ASE)
Spatial Daylight Autonomy (sDA) and Annual Sunlight Exposure (ASE) are two critical metrics for better understanding of annual daylight availability and quality, as well as glare and overheating potential. As per the LEED requirements, sDA(300/50) for at least 55% or 75% regularly occupied floor area is achieved. Additionally, ASE(1000/250) of no more than 10% for the occupied floor area that is daylit per sDA(300/50). LEED requires the analysis to occur at 30 inches above the finished floor. The analysis plane automatically is generated at this height for LEED studies. sDA and ASE calculations require a 24-inch analysis grid, which is automatically set. Refer here for more information.
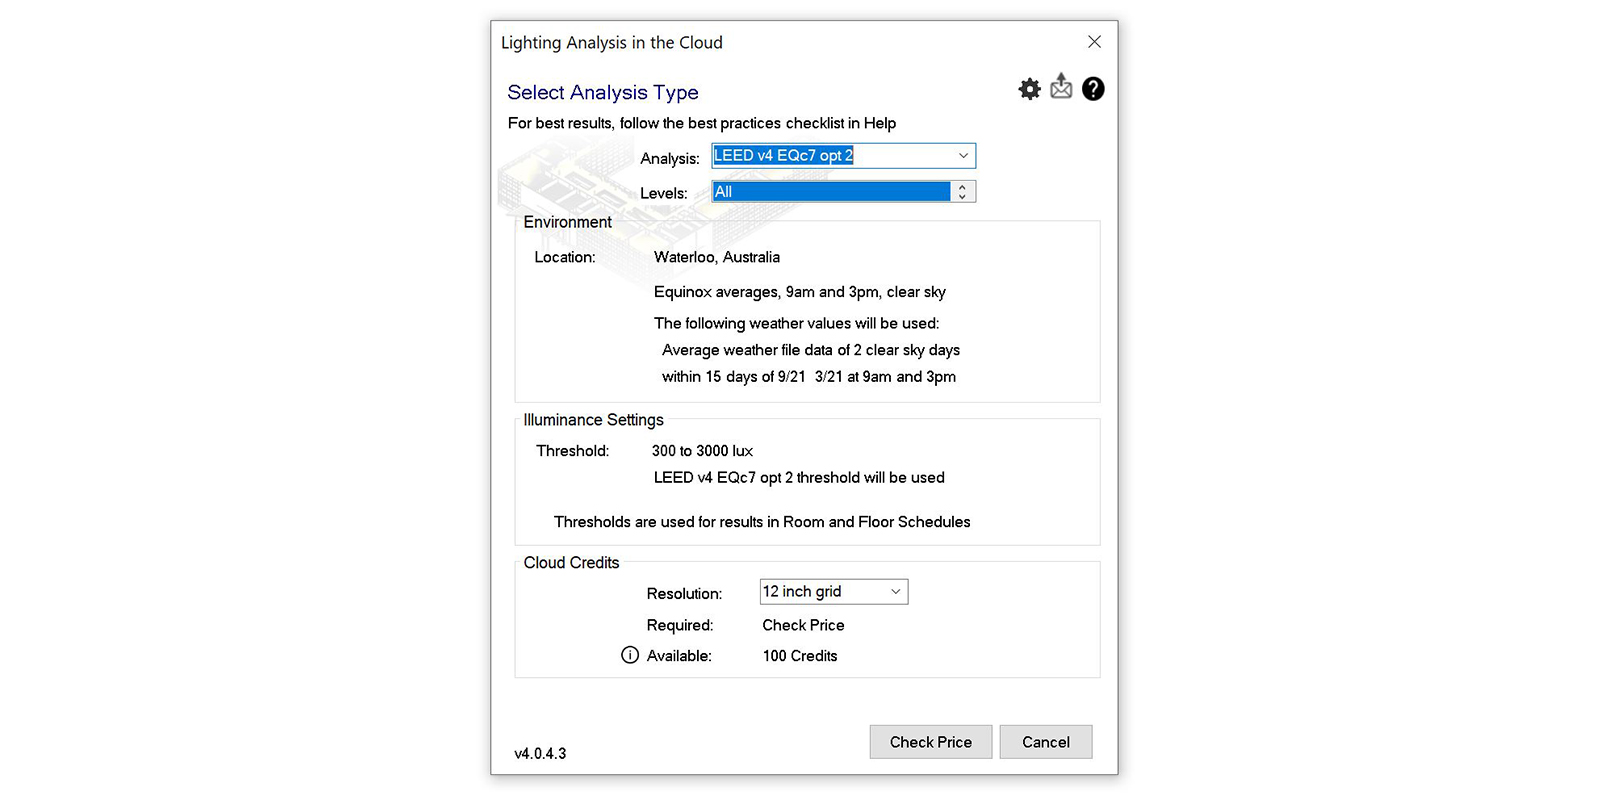
Step 4F: LEED v4 EQc7 opt 2
This analysis checks that the illuminance levels will be between 300 lux and 3,000 lux for 9 am and 3 pm, both on a clear-sky day at the equinox, for the floor area. The minimum resolution grid is 12 inches (30cm).
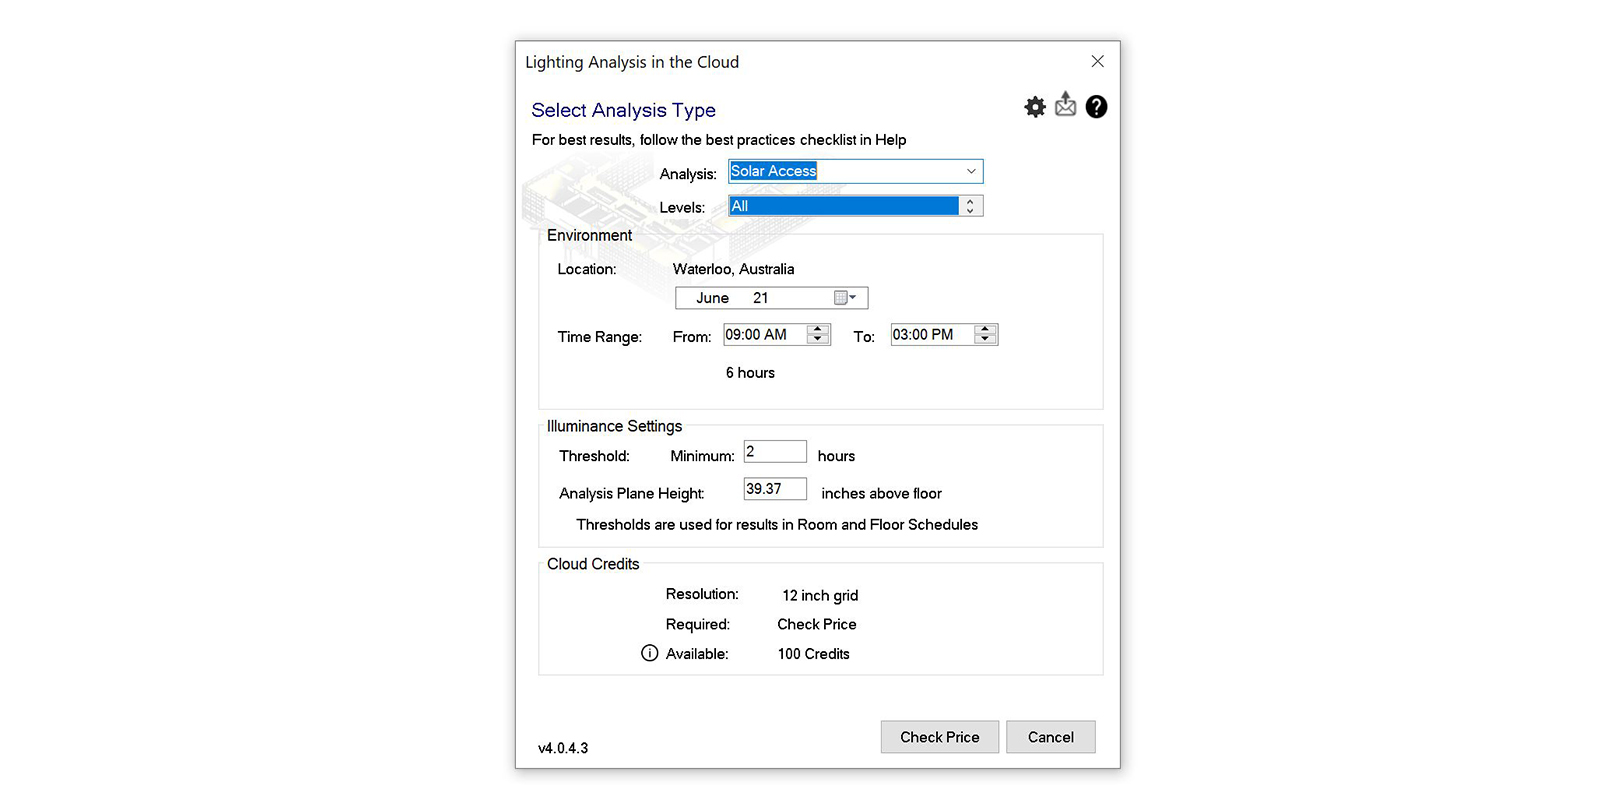
Step 4G: Solar Access
The solar access setting is the one which best approximates the SEPP65 solar access requirement in Australia. The date should be modified to 21 June and the time range set to 9 am to 3 pm. Depending on your specific location in NSW, the threshold will either be 2 hrs for Sydney Metropolitan Area and in the Newcastle and Wollongong local government areas, or 3hrs for all other locations.
Note that there is no way to change the analysis plane height unit. Therefore, to meet the SEPP65 requirement that the analysis plane must be 1m above finished floor level, set it to 39.37 inches. Note that it is also not possible to change the default 12-inch (30cm) resolution grid either
Unlike the previous analysis methods described above, solar access has no help or additional information on how illuminance thresholds are defined. However, according to this post, Autodesk has decided that to meet the minimum threshold, any point in the room must exceed 4000 lux. Furthermore, for all hours selected, the Direct Normal Irradiance (DNI) and Global Horizontal Irradiance (GHI) will be set to 1000 W/m2, and Diffuse Horizontal Irradiance (DHI) will be set to 1 W/m2. It is unclear if this is still the case in the most recent version of Insight.
The other issue of note is that Insight does not specify the time step used for the analysis. That is, the number of times per hour the analysis is run to calculate the total number of hours complying. SEPP65 requires 15min intervals but nowhere does Insight make explicit the settings it adopts.
Step 5: Check the price
It is advisable only to run one level at a time to make sure all of your settings are correct before committing to a full (all level) analysis to keep the cost to a minimum.
Step 6: Run the analysis
After you have checked the price and accepted, your model will be uploaded to the cloud for analysis. While this is happening, do not close the project.
Step 7: Accept the results
Once the analysis has completed running in the cloud, you will be notified and prompted to accept the results.

Once accepted, a series of views will automatically be generated in your Revit model. This process may take some time depending on how many levels you specified in the analysis settings. The views will be prefixed with ‘_InsightLighting’. A series on parameters will also be added to rooms and populated with the results.
Step 8: Visualise the results
To view the results, go back into Insight (Analyse> Insight > Lighting) and selected the analysis to be displayed. The asterisk (*) at the front of the name represents the current analysis being displayed. Results are presented on your Revit model using the Analysis Visualization Framework (AVF), so you can see precisely how daylight is interacting with your Revit model.

To configure the analysis display style, go Manage > Settings > Additional Settings > Analysis Display Styles. You can either create your own or modify one of the default styles. To achieve a Ladybug colour scheme, use the following RGB values:
| Hours | Colour (R,G,B) |
|---|---|
| 6.00 | 234,38,0 |
| 5.75 | 234,44,0 |
| 5.50 | 234,60,0 |
| 5.25 | 234,82,0 |
| 5.00 | 234,104,0 |
| 4.75 | 234,120,0 |
| 4.50 | 234,126,0 |
| 4.25 | 235,134,6 |
| 4.00 | 239,155,21 |
| 3.75 | 244,185,42 |
| 3.50 | 249,214,63 |
| 3.25 | 253,236,78 |
| 3.00 | 254,244,84 |
| 2.75 | 249,241,95 |
| 2.50 | 234,234,125 |
| 2.25 | 214,224,166 |
| 2.00 | 193,213,208 |
| 1.75 | 178,206,238 |
| 1.50 | 173,203,249 |
| 1.25 | 166,197,244 |
| 1.00 | 148,179,229 |
| 0.75 | 124,155,209 |
| 0.50 | 100,131,189 |
| 0.25 | 82,113,174 |
| 0.00 | 75,107,169 |
Analysis comparison
In terms of accuracy, the image below represents a comparison between an Insight solar access analysis (left) and a Ladybug solar access analysis (right) run with Rhino.Inside Revit. Both are using the same latitude and longitude, and the geometry is identical. The legend and colour schemes are also consistent. As you can see, there are subtle but noticeable differences between the results.
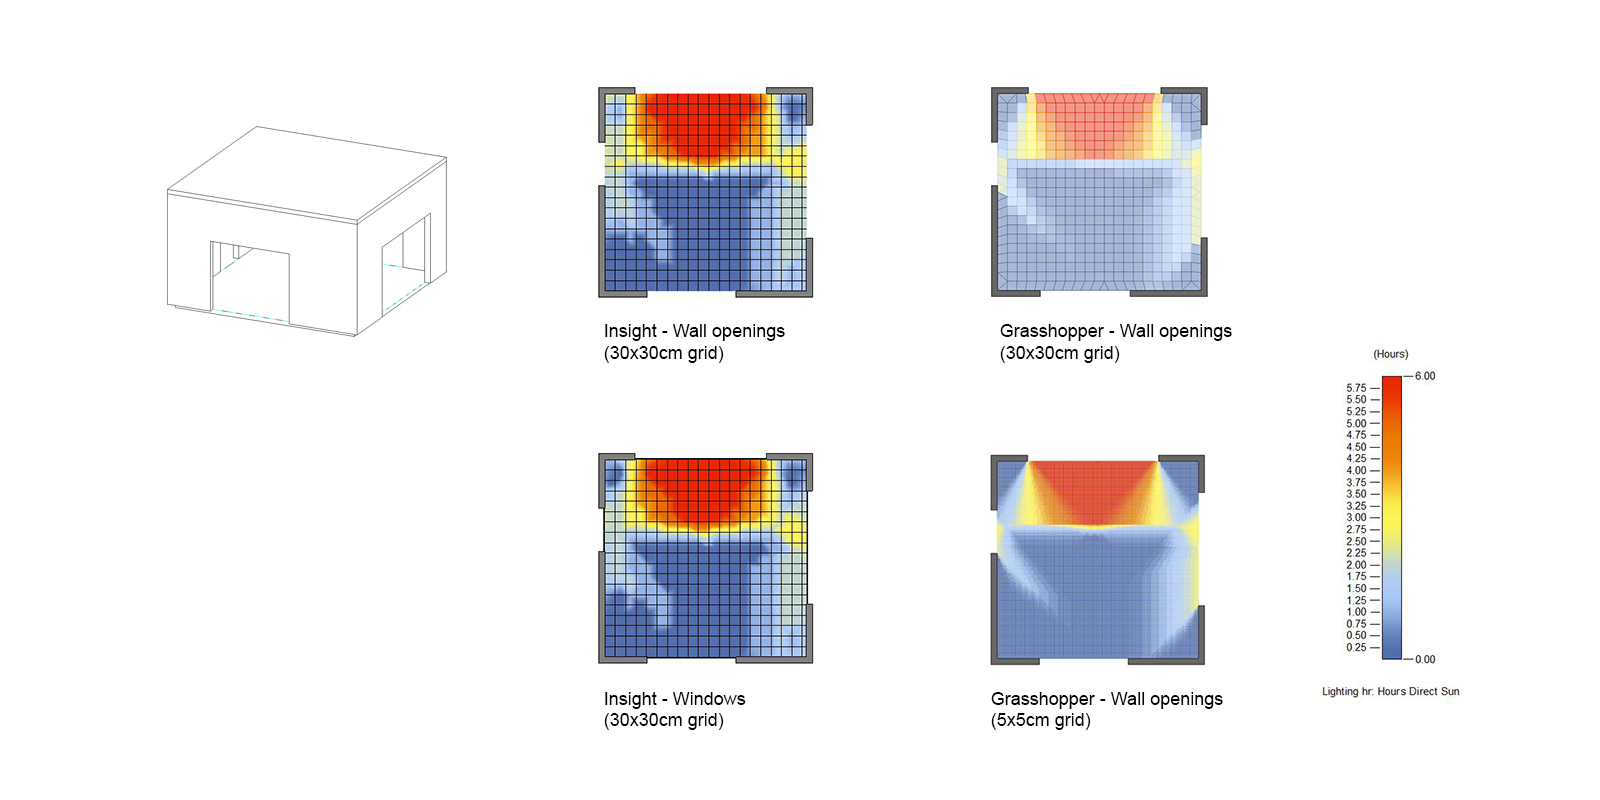
Even though the analysis grid is set to 12 inches (30cm), Insight applies a gradient colour across the mesh. When running with wall openings only (top left), there is more direct sun compared to when windows are added (bottom left). These results demonstrate that the glazing material is having an impact (but can be overcome using the hide geometry in view technique described earlier).
Using the same analysis grid size (30cm), Grasshopper returns cleaner and arguably more accurate results (top right). Refining the analysis grid to 5cm (bottom right) for example provides even greater accuracy and contrast between the two software.
Conclusion
Insight is a handy tool if you want to stay within the Autodesk ecosystem, but it comes as a cost. The first is accuracy. While the results might be close enough for some, I would caution the use of the software for any compliance testing, such as SEPP65 solar access. There are just too many limitations, assumptions and ways that a user can perform an incorrect analysis. The analysis grid can only ever be 12×12 inches, the analysis plane cannot be set in metric, and it is unclear the time step used. But most importantly, because Insight uses an illuminance-based analysis, it cannot satisfy the requirement of a ‘direct beam radiation from the sun’.
Processing time is also a huge negative. Don’t be fooled by ‘cloud-based analysis’ to think that the analysis will be fast. The process is very slow – Slow to upload your Revit model, slow to run the study, and slow to visualise the results. Large projects could take several hours to run.
The other major downside to Insight is the cost. The default cost for cloud credits in Australia is $150/100 credits. For a model with 200 apartments, a single run may cost 200+ credits, the equivalent of over A$300. Given that most analyses will need to be run multiple times due to design changes, the costs can quickly add up. If you are a part of a large organisation and have access to cheaper cloud credits, than the price might play less of a factor in your decision to adopt Insight. But ultimately, I still recommend using Grasshopper and Ladybug for all solar access analysis as it is quicker, more economical and most importantly, more accurate.


6 Comments
Martin Bevz
Thanks for the step-by-step Paul — very insightful (pardon the pun). Interesting point on accuracy, as it’s hard to validate the results. You really need to trust the software, especially with so many assumptions running in the background. The Grasshopper results are definitely more legible, and you could argue that’s more important than absolute accuracy.
paulwintour
Hi Martin.
The accuracy comparison only related to solar access. I didn’t undertake a comparison for daylight and it would be much harder to ascertain which software is correct. But yes, by Autodesk making things ‘easier for the user’ by hiding settings, it is difficult to trust the software as you don’t know what is going on under the hood. Whenever for example I see dollar values on energy savings (or construction costs) like in the old Green Building Studio, I’m always skeptical as there are just too many assumptions which aren’t explicit.
David Valent
Have you found a way to save the data in Revit, I find the Surface Analysis data gets deleted if the model is updated synced or closed as per the Revit docs (last sentence here)
https://knowledge.autodesk.com/support/revit-products/learn-explore/caas/CloudHelp/cloudhelp/2014/ENU/Revit/files/GUID-DCA1C6D3-FBD0-4188-A5C2-51821027435E-htm.html
paulwintour
Hi David.
Autodesk have to make their money somehow! But in all seriousness, no I haven’t. It is a major flaw. Running analyses in Dynamo has the same problem.
Since the data is in the model their probably is a way to extract it and then either store it externally, such as a csv file, or replicate the results with more permanent elements such as import instances or adaptive components. But it’s a lot of effort for something which should already exist out of the box.
Maria Cughtai
Greetings,
Thank you so much for the detailed information. I have a question realted to an issue that I am facing.
I am trying to run a Daylight Factor Analysis using Revit 2021 and my project has 5 different levels. I want to run analysis on ground and first floor together but the Floors not shown in the sequence I want while running the analysis. Initially I used to press shift and select multiple floors that I wanted to run my analysis on. But because they are listed in a very odd sequence, I am unable to select 2 floors together without selecting two more floor levels. Consequently, it is making it impossible for me to select two floors that I want in my analysis. I don’t want to run 2 separate analyses because then I would have to combine both in excel and that is a very lengthy process.
I usually add a number before my floor levels so that I am able to see it in a sequence within my project browser. I tried removing the numbers as well to check whether that sequence changes in the analysis dialog box but no avail. I have tried creating new files, copying the existing structure to another file as well but nothing seems to work.
Do you know how to cater this issue?
Thanks.
Paul Wintour
Sorry, Maria. I haven’t come across this problem and I’m not sure how to fix it. Sounds like you have tried everything already…