
Marketing plans, sometimes known as sales plans, are designed to assist buyers when buying off-the-plan. The creation of these plans is often a tedious task, involving significant repetition and the possibility of human error. This tutorial describes how the process of creating marketing plans can be automated using Dynamo.
Background
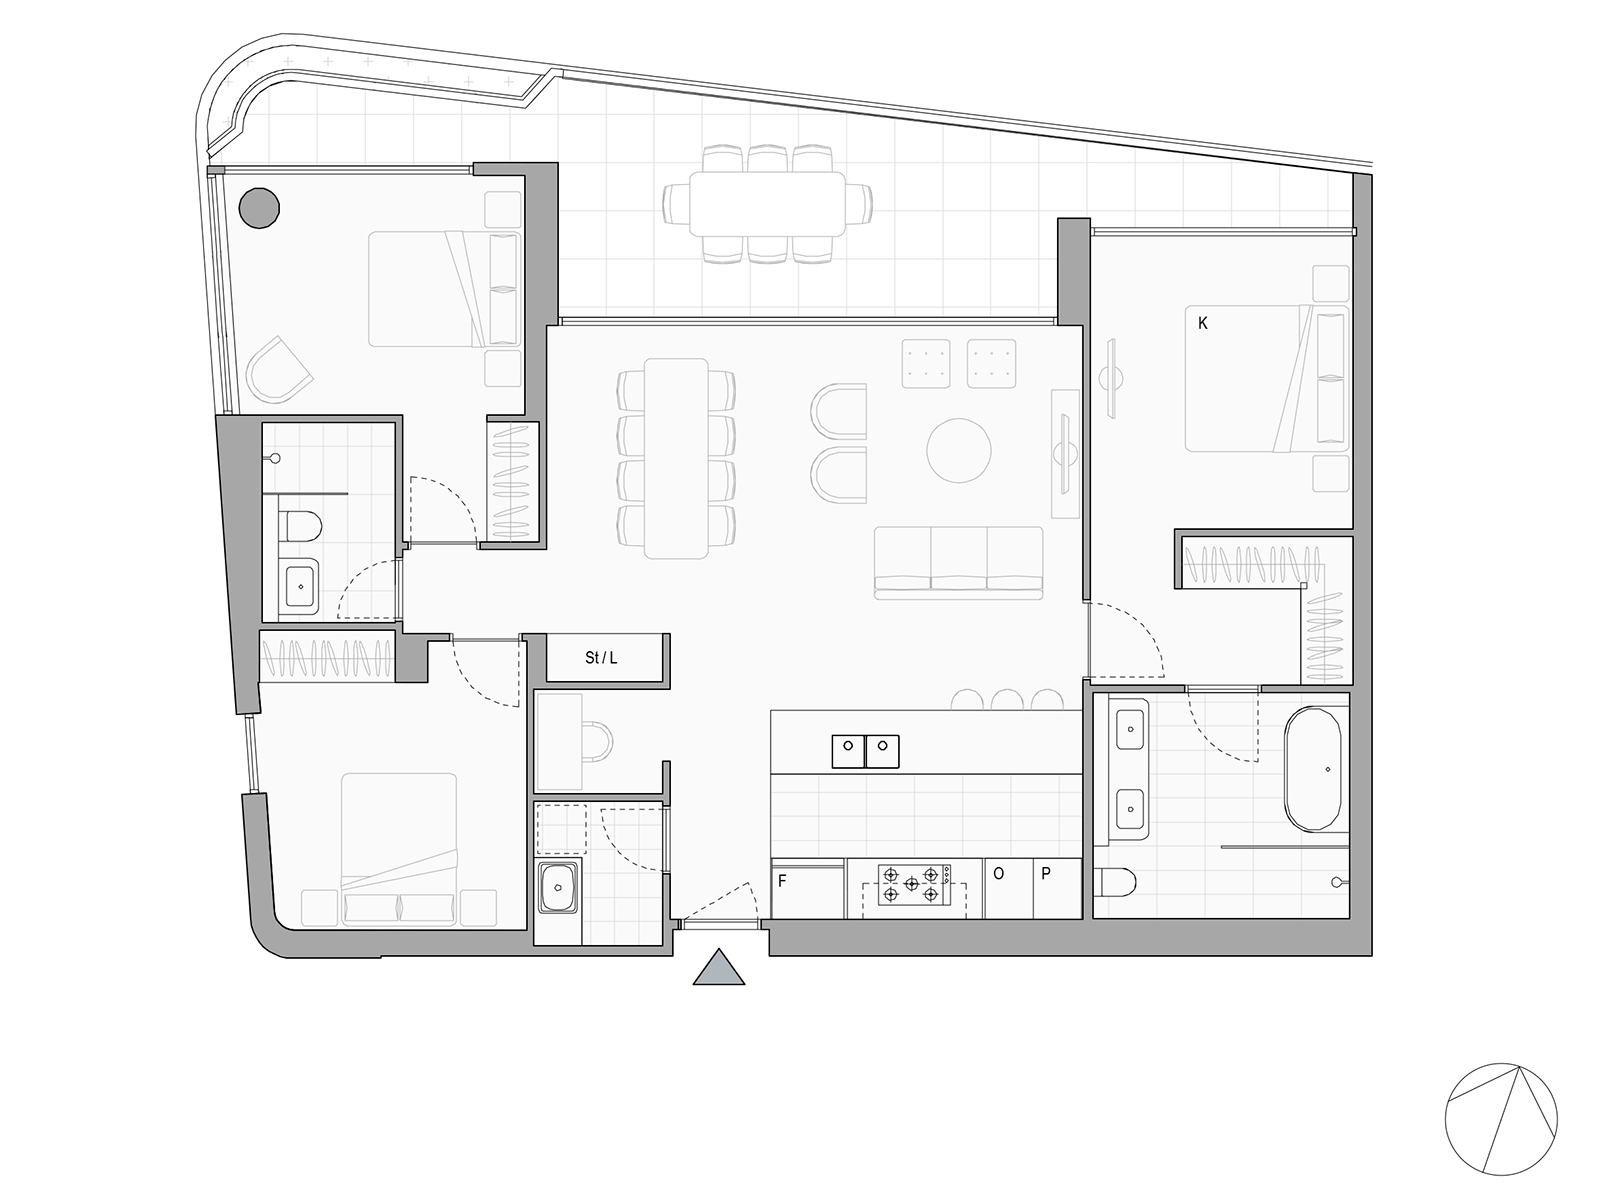
When designing an apartment complex, a developer will often ask the architect to produce a series of marketing plans. These views are for a separate sheet set and show a single apartment per sheet, usually at 1:50@A3. The purpose of the marketing plans is two-fold. Firstly, they are displayed in the project showroom to assist buyers when buying off-the-plan. Once sold, a small sticker is then placed on the sheet to indicate that it is no longer available (and no doubt to encourage fear-of-missing-out syndrome to other prospective buyers). Secondly, the drawing will form part of the sales contract if the building isn’t completed as proposed.
The workflow
Depending on the size of the apartment complex, the process of creating marketing plans can take weeks. The process usually involves the following steps:
- Duplicating the GA floor plan
- Renaming the view
- Assigning a presentation view template
- Crop the view to the bounding box of the apartment, inclusive of any external balconies or terraces
- Masking any unnecessary information, such as adjacent apartments
- Rotating the view so that the entry door is at the bottom of the sheet. (Apparently, this is more legible as buyers have mental difficulty rotating a view displayed at True North or Project North.)
- Creating a new sheet
- Placing the view on the sheet
- Updating the various title block instance parameters for the key plan, north point rotation, and the internal and external area.
This process is then repeated for every apartment! Some efficiencies may be possible if floorplates are repeated, but in my experience, the client will still want individual sheets to avoid doubt.
The problem
In addition to the sheer amount of time required to undertake the process, there is also a high risk of manual errors. Revit is very particular about how views can be rotated. Moreover, Revit doesn’t easily display what the new rotation value is. A user, therefore, has to calculate what the north point rotation needs to be manually.
Secondly, a user needs to ensure that the key plan is set correctly on every sheet. With views being rotated independently and apartments looking very similar, it can be easy to indicate the wrong apartment on the key plan accidentally. This error can become problematic if not picked up before the sales contract is made.
Creating marketing plans with Dynamo
Parametric Monkey has developed two Dynamo Player graphs, available as part of our Dynamo Package Development service, to help solve this problem. The first graph, Create Marketing Plans, creates individual floor plans for each apartment, renames the view, assigns a view template, crops the view, and rotates the view (steps 1-4 & 6). The second graph, Marketing Plans on Sheet, creates the sheet, places the view on the sheet, and updates the various title block properties (steps 7-9).

Before running the graph, ensure that all balconies/terraces have rooms and that the ‘Renumber Balconies‘ graph has been run. This process will provide the correct pairing of the apartments to their external area. To run the graph:
- Define the ‘Apartment Number’ parameter. This value will be used for the view naming, e.g., “101”. If no parameter of that name exists of category ‘Rooms’, an error will be returned.
- Define the ‘Apartment Room Name Contains’ value, e.g., “BED” or “APARTMENT”. Room names that contain this value will be for the view generation process.
- Define the prefix to be assigned to the new view names, e.g., “SP” for sales plans.
- Set the view template to be assigned to the view.
- Define the entry door family type for the entry door. Up to two family types are supported.
- Define the offset to be applied to the bounding box of the view’s crop region.
- Press Play to run the graph.
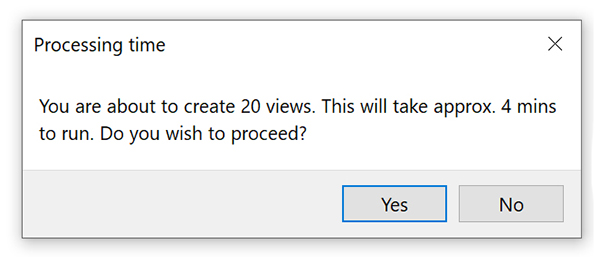
A dialogue box will be displayed confirming the number of views to be created, along with a time estimate. The user can abort the graph by pressing ‘No’, which is useful if the graph will take a long time and you prefer to run it over lunch or after work hours.
Computational logic
The graph collects all placed rooms in the project and filters them by name so that only the apartments remain. Balconies and terraces are ordered and paired with their associated apartment by matching the apartment number parameter with a “.B” suffix (refer Renumber Balconies graph).
Floor plan views are then created for each apartment with a view template assigned. If the view name already exists, it is excluded from the process and returned separately. Views are named “Prefix_Apartment Number”, e.g. “SP_101”. A simple rectangular bounding box of the apartment/balcony pairing is then used with the defined offset to crop the views.
The entry door of each apartment is determined based on the family types supplied. Views are then rotated based on the entry door’s host wall orientation so that the interior face is pointing up the page. This rotation value is rounded to two decimal points in case the elements are not entirely orthogonal.
Views that were successfully rotated are returned separately. Views which couldn’t be rotated, as no entry door could be found, are cropped and returned separately.
Limitations
Currently, the graph does not mask any elements once the floor plan has been created (step 5). While architects may model apartments as a model group allowing for neighbouring apartments to be filtered out, marketing plans are required to show party walls plus external areas. These elements are generally modelled separately from the apartment model group. The difficulty, therefore, arises in determining which elements need to remain visible and which elements can be hidden. Identifying the room’s bounding walls is possible. However, the complexity arises with how Revit deals with wall joints.
Walls in Revit have an interior and an exterior face. This quirk means that for a party wall separating two apartments, one apartment will share the ‘interior’ face. In contrast, the other apartment will share the ‘exterior’ face, even though both wall faces are technically internal. Therefore, we would need to extract both faces of the party wall to determine which was the outermost, as we want to see the wall thickness in our plans. This workflow is achievable.
But then we have other wall elements intersecting the party wall, such as service risers. Depending on the wall assembly’s layer build-up, wall joins can become complex and even produce inaccuracies in the room boundary. We may also have columns that overlap the party walls.
Calculating the external perimeter of an apartment, including its external area, can therefore become very complicated. Depending on the design and the modelled methodology used, it may be possible to define the masked region and/or hide elements accurately. However, it can become messy and is best only included if conditions allow.
Conclusion
Creating marketing plans for each apartment can be a tedious and error-prone task. However, Dynamo affords us the possibility to both significantly reduce the time needed to complete the job, and minimise the chance of errors. To find out more about our Dynamo Package Development service, drop us a line and discover how we can automate your Revit workflows.