
Recently I was charged with setting up a digital City of Sydney model acquired from AAM. This process was a steep learning curve into GIS and large data sets. I thought I would share with you some of my findings if ever you are in a similar position.
Background
AAM is a Geospatial Services company specialising in the collection, analysis, presentation and delivery of geospatial information. AAM currently provides the City of Sydney with 3D GIS data, including Initial Data Extraction (IDE) model that is received if preparing Development Applications. The model’s extents is that of the Sydney Local Government area, which stretches from Moore Park to Glebe, and the CBD to Mascot. Therefore, it does not include the entire metropolitan area. Depending on your licencing agreement, there are several models on offer including:
- Untextured building model LOD1 (2013);
- Textured or Untextured building model LOD3 (2013); and
- Textured terrain mesh (2008-2013).
File formats
The building models are supplied in both mesh (*3DS and *OBJ) and polygon (*DGN and *DWG) formats. The models were digitised using photogrammetric methods from aerial imagery captured on 25-28 February 2009 and updated from imagery capture on 7 March 2013. Please keep in mind the date when the dataset was created. Certain key buildings are not in the model, including One Central Park, Barangaroo and the Convention Centre.
Level of Detail
LOD stands for ‘Level of Detail’. LOD3 is the highest resolution available. The LOD1 model takes the highest point of the building and creates an extrusion. It is therefore much lighter in file size and useful if limited detail is required. Both the LOD1 and LOD3 models extend down to RL0. That is, there are no topographic ‘pads’. Buildings intersect the topography instead of sitting on it. Apart from the LOD differences, there are also some other differences depending on which model you use:
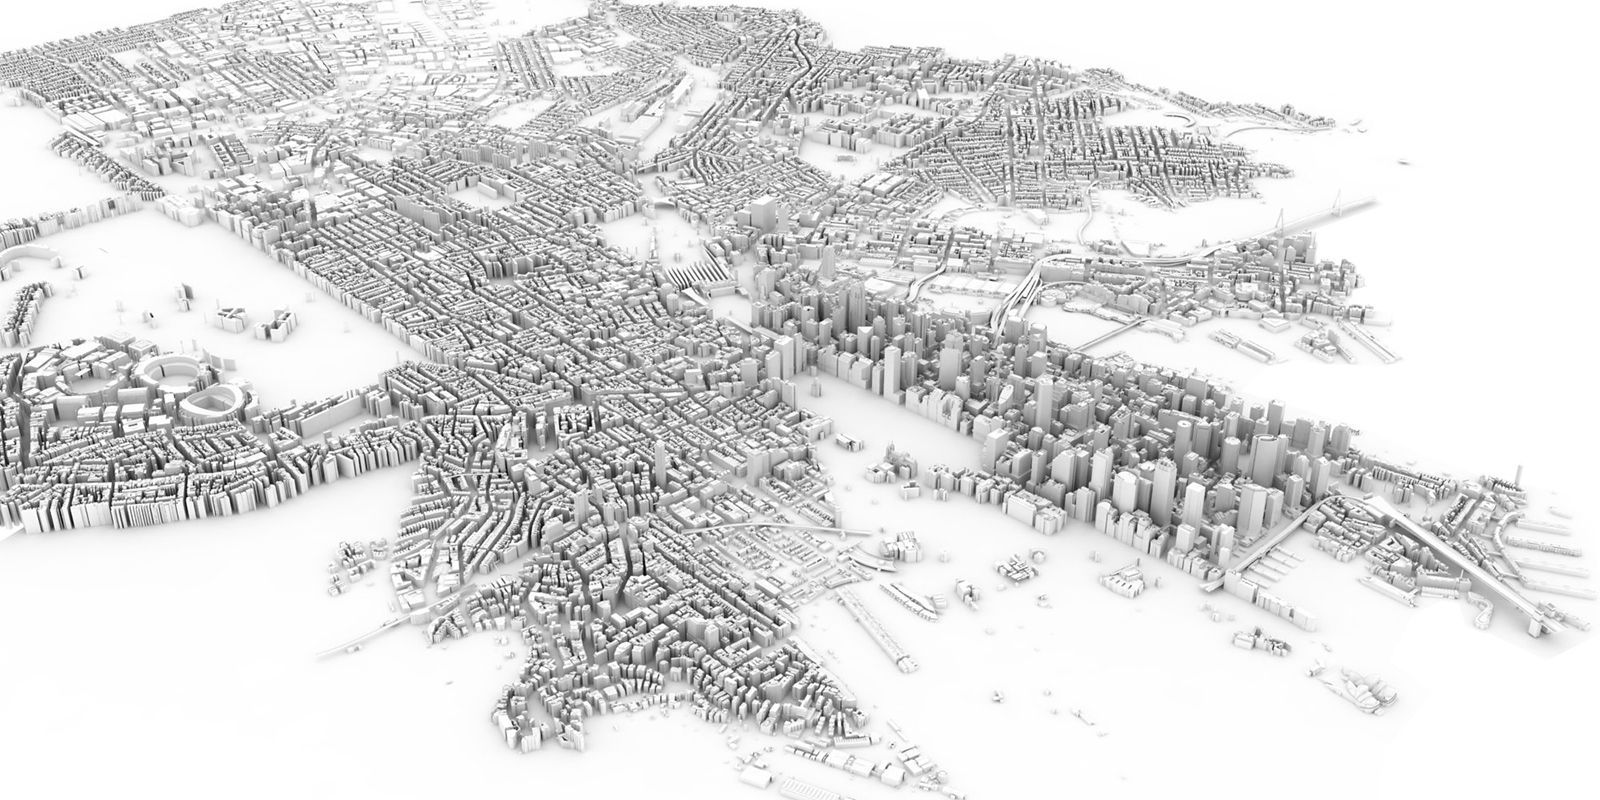
- The LOD3 buildings are not ‘watertight’ in that they have no base. Generally, this would cause issues if trying to 3D print the model. However, preliminary test with Cura and an Ultimaker 2 Extended + printer have been positive, indicating that no file cleanup is required.

- The LOD1 model is property aligned in the CBD. This means the raw data has been manually adjusted to match cadastre information, whereas the rest of the city has not. The model is watertight and should 3D print without any issues.
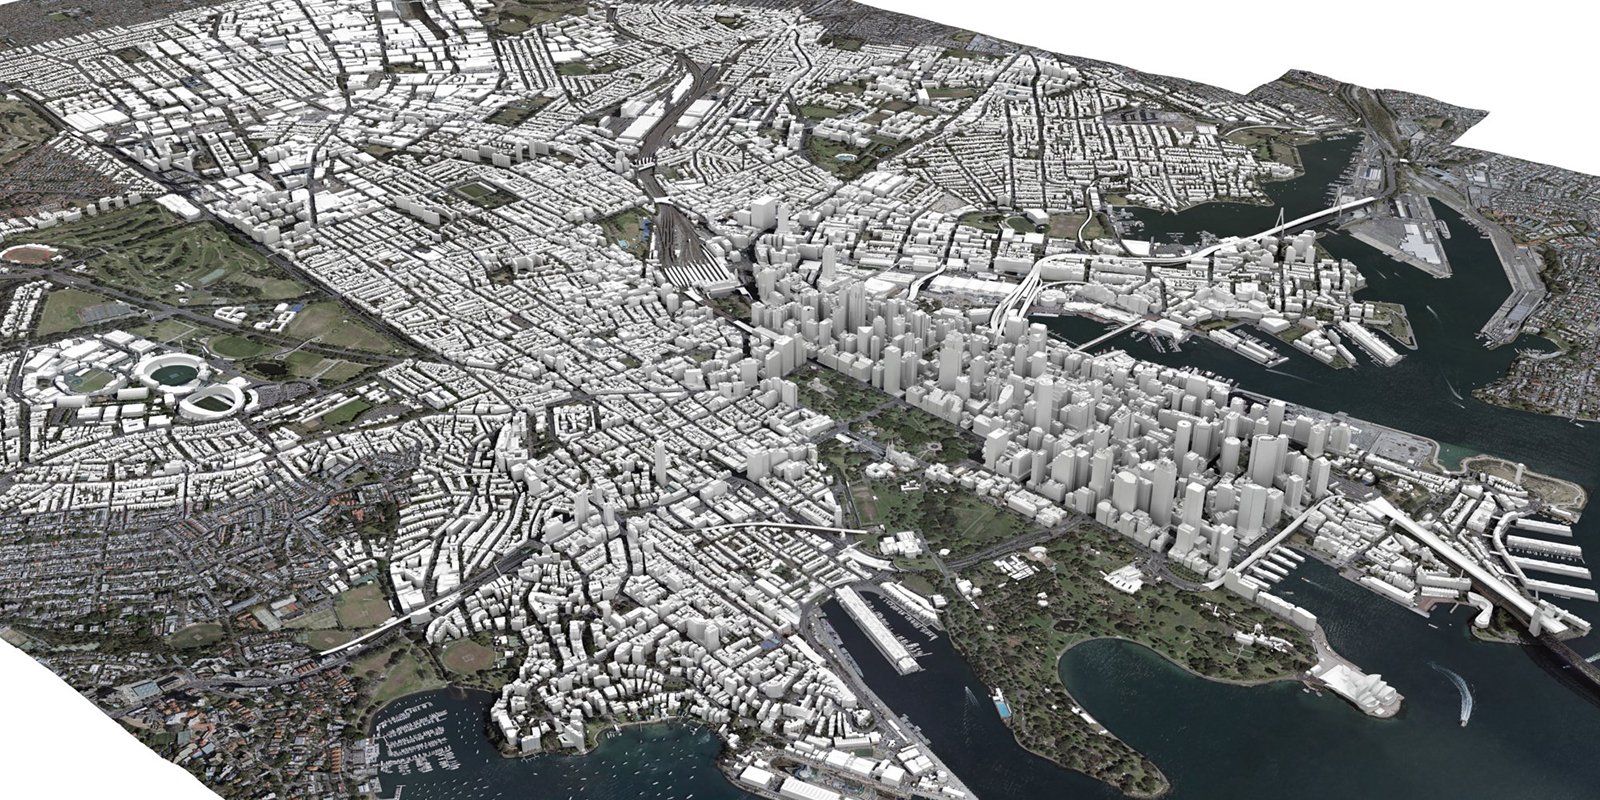
- The terrain model was acquired using Airborne Laser Scanning (ALS) data for the Sydney metropolitan area. This file contains a TIN from thinned ground classified LiDAR points in *OBJ and *3DS format. The data has been acquired from February to June 2008. The terrain is textured and broken into 500x500m tiles. This file size of this model is considerable and is very difficult to use due to the sheer number of sample points.
Coordinate systems
AAM supplies models using both a Georeferenced and Project Local coordinate system. Both are available in either millimetres and metres. The Georeferenced coordinate system uses Map Grid of Australia Zone 56 (GDA94) [EPSG: 28356] whereas the Project Local has an origin point of 335,000 E, 6,250,000 N (MGA56).
Georeferenced
The Geocentric Datum of Australia 1994 (GDA94) is an Earth-centred datum, which has been adopted for use throughout Australia by the Inter-Governmental Committee on Survey and Mapping (ICSM) with all states and territories adopting it in 2000. The map projection associated with GDA94 is the Map Grid of Australia 1994 (MGA94). This is a transverse Mercator projection, which conforms with the internationally accepted Universal Transverse Mercator Grid system.
The datum which is currently applied as the national standard throughout Australia is the Geocentric Datum of Australia (GDA), which was first implemented in 1994. When applied as a geographic coordinate system, GDA is known as GDA94. Conversely, when applied as a projected coordinate system, GDA is referred to as the Map Grid of Australia 1994 (MGA94). For more detailed information of Australia’s coordinate system, refer to this tutorial.
Note that if you plan of combining this City of Sydney model with Open Street Map data imported from Elk or Flux’s Site Extractor, this information will come in using WGS84 and not MGA94. WGS84 is the World Geodetic System 1984. It provides the current standard for locational measurement worldwide, particularly in conjunction with the Global Positioning System (GPS) satellite network.
Project Local
The Project Local coordinate system has been repositioned from the Georeferenced location and is located at the corner of Crown St & Kings Lane, Darlinghurst. The reason for this is due to software issues with geometry being too far away from the default origin (0,0,0). Since the City of Sydney also uses the same Project Local coordinate system, I would recommend also adopting this system. This means that if you have adopted the Project Local coordinate system and receive a model or drawing at MGA94 coordinates, you will need to move it as follows to get it to the Project Local coordinate system:
- X = -335,000m
- Y = -6,250,000m

The exception to this is if you need to model the sun angle planes as defined in Section 6.17 of the LEP. For whatever reason, as it is not documented, the City of Sydney has decided to use truncated MGA coordinates which are different from the coordinate systems above. Georeferenced coordinates would be truncated as follows:
- LEP: 34067E, 49731N
- Actual GeoReferenced : 334067 E , 6249731 N
Model setup
Depending on the software you intend on using to view the model, you’ll want to use different file formats of the raw data when setting up your projects. In general, meshes will produce considerably smaller file sizes. However, these can be difficult to manipulate and may cause visualisation issues due to the mesh triangulation. If for example, you use Rhino, the *DGN files import better than the *DWG file. This difference is because the *DGN files bring in surfaces whereas the *DWG brings in meshes and hatches. If you use the *DWG files, then the hatches need to be exploded to be turned into surfaces and then the meshes deleted.
Conclusion
The AAM city models are a great resource and add a whole new level of sophistication to the design process. It provides relatively accurate information to aid you in undertaking solar access analyses, view analyses, and overshadowing analyses. Watch this space for more tutorials on integrating GIS datasets.


2 Comments
Kevin Chuang
Hi Paul,
Is it possible to access this 3D model anywhere? We currently working on a part of the Sydney CBD for a 3rd year UTS design project and would like to use such a model for a base reference.
Regards
Kevin
paulwintour
Hi Kevin. I am afraid not. AAM own this model and you need to purchase it through them. However, you can contact them and they may supply you with a student version.